
Reputation: 1777
Xcode 4.3.2 will not show full caller stack in debugger, only current function?
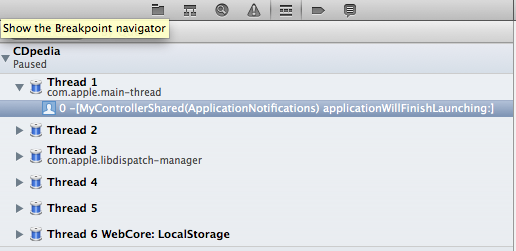
Xcode 4.3.2 won't show me the caller stack for a Mac OS X application in the debugger. In the following image is the issue I am referring to, the stack only includes the current function:
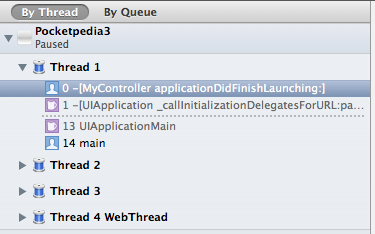
The output of the stack should include the caller functions as such (taken from iOS that does not show the same debugging issue):
I have all the latest settings, the "validate build settings" runs without warning. I use pretty much the defaults as they come for a new project, here they are for my debug scheme:
- architecture = 32-bit Intel
- SDKROOT = macosx
- Debug Information = DWARF
- Deployment target = 10.5
- Strip debug symbols during copy = NO
- LD_RUNPATH_SEARCH_PATHS = @loader_path/../Frameworks
- ALWAYS_SEARCH_USER_PATHS = NO
- Optimization level = None
- Symbols hidden by default = NO
- Garbage collection = required
- GCC_PRECOMPILE_PREFIX_HEADER = YES
- GCC_PREFIX_HEADER = MyHeader_Prefix.h
- WARNING_CFLAGS = -Wmost -Wno-four-char-constants -Wno-unknown-pragmas
- IBC_WARNINGS = NO
- IBC_Strip_nibs = NO
Using a different debugger under "Edit Schemes", GDB over LLDB has the same issue. Switching compilers to LLVM also has no effect.
Clearing the derived data and cleaning the project has not helped. Also removing the pre-compiled information from /var/folders/ has proved unsuccessful.
It's a complicated question I just wanted to find out if anybody out there had a similar experience and was able to fix it. As it has worked for years and only recently stopped working.
Upvotes: 10
Views: 2580
Answers (2)

Reputation: 10380
This is an old post but I was having the same issue with Xcode 7.2.1. It turns out I had some old text in the filter search bar at the bottom of the pane. Once I cleared that out it works as expected.
At least I learned some lldb commands along the way.
Upvotes: 3

Reputation: 4272
You can adjust the level of detail of the call stack display.
Look at the bottom side of the Debug Navigator :)

Upvotes: 23
Related Questions
- Xcode no longer showing stack trace by thread in the debugger navigator on pause
- Xcode stack trace not appearing in console
- Xcode 4.2 debug doesn't symbolicate stack call
- Can't see debug info Xcode 6.4?
- Xcode 4 not showing line that debugger is stopped on
- Xcode 5.1 call stack in debug , show only thread without any info about the functions in c++
- Stack trace in Xcode 5 won't work
- No call stack on Exception in xCode 4
- How to display the exact line of code causing application crash in xcode 4 debugger like in xcode 3.2
- Xcode debugger: Code window does not match stack window