
Reputation: 1063
Transform color scale, but keep a nice legend with ggplot2
I have seen somewhat similar questions to this, but I'd like to ask my specific question as directly as I can:
I have a scatter plot with a "z" variable encoded into a color scale:
library(ggplot2)
myData <- data.frame(x = rnorm(1000),
                     y = rnorm(1000))
myData$z <- with(myData, x * y)

badVersion <- ggplot(myData,
              aes(x = x, y = y, colour = z))
badVersion <- badVersion + geom_point()
print(badVersion)
Which produces this: 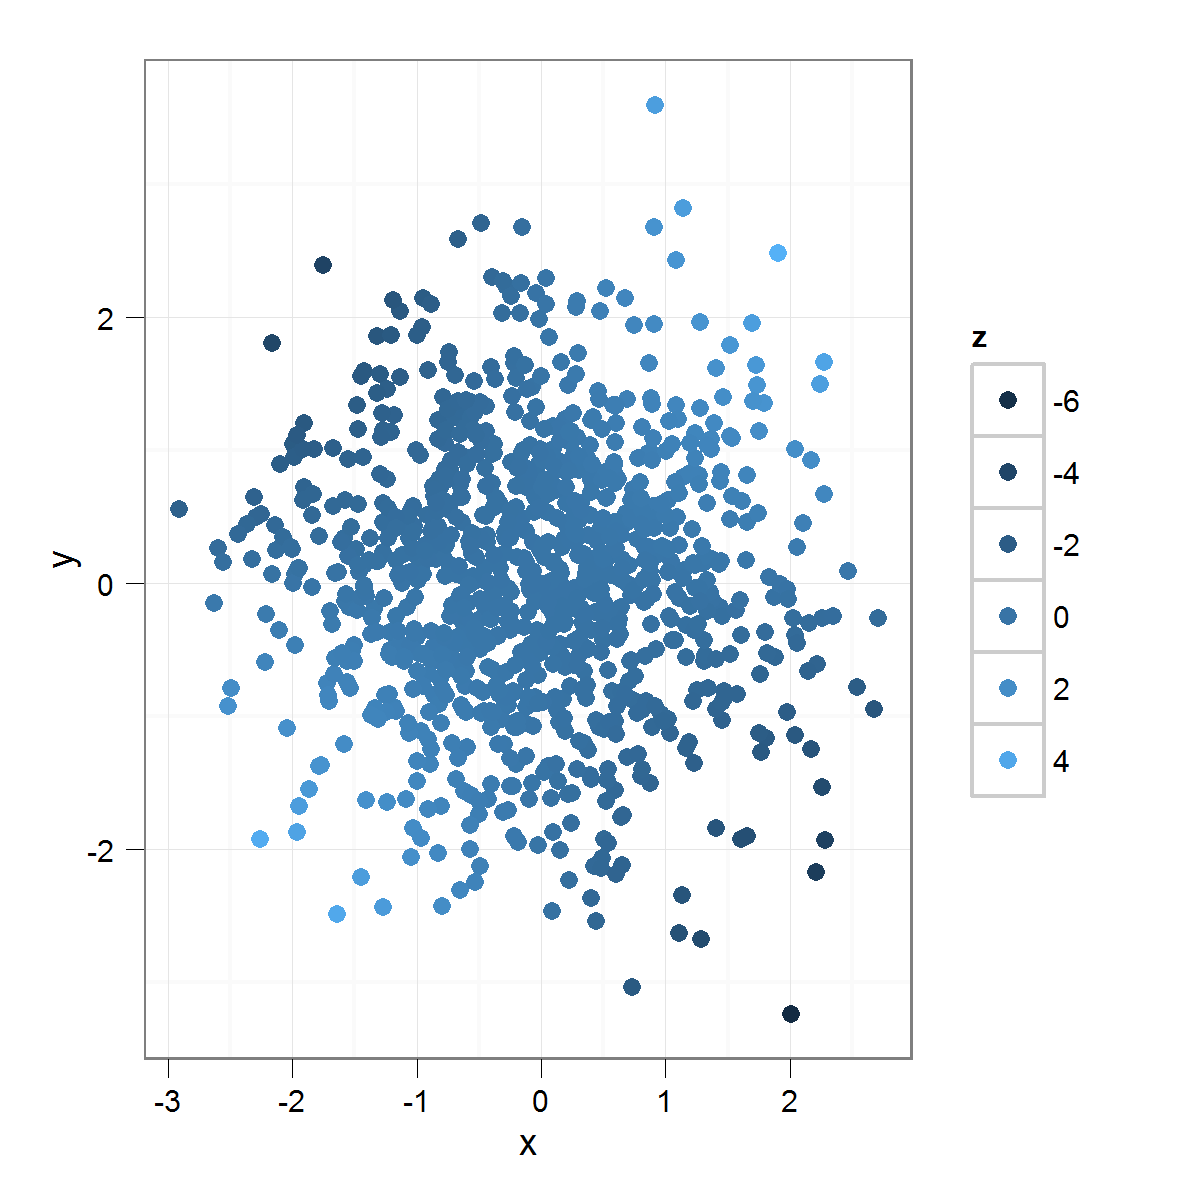
As you can see, since the "z" variable is normally distributed, very few of the points are colored with the "extreme" colors of the distribution. This is as it should be, but I am interested in emphasizing difference. One way to do this would be to use:
betterVersion <- ggplot(myData,
                        aes(x = x, y = y, colour = rank(z)))
betterVersion <- betterVersion + geom_point()
print(betterVersion)
Which produces this: 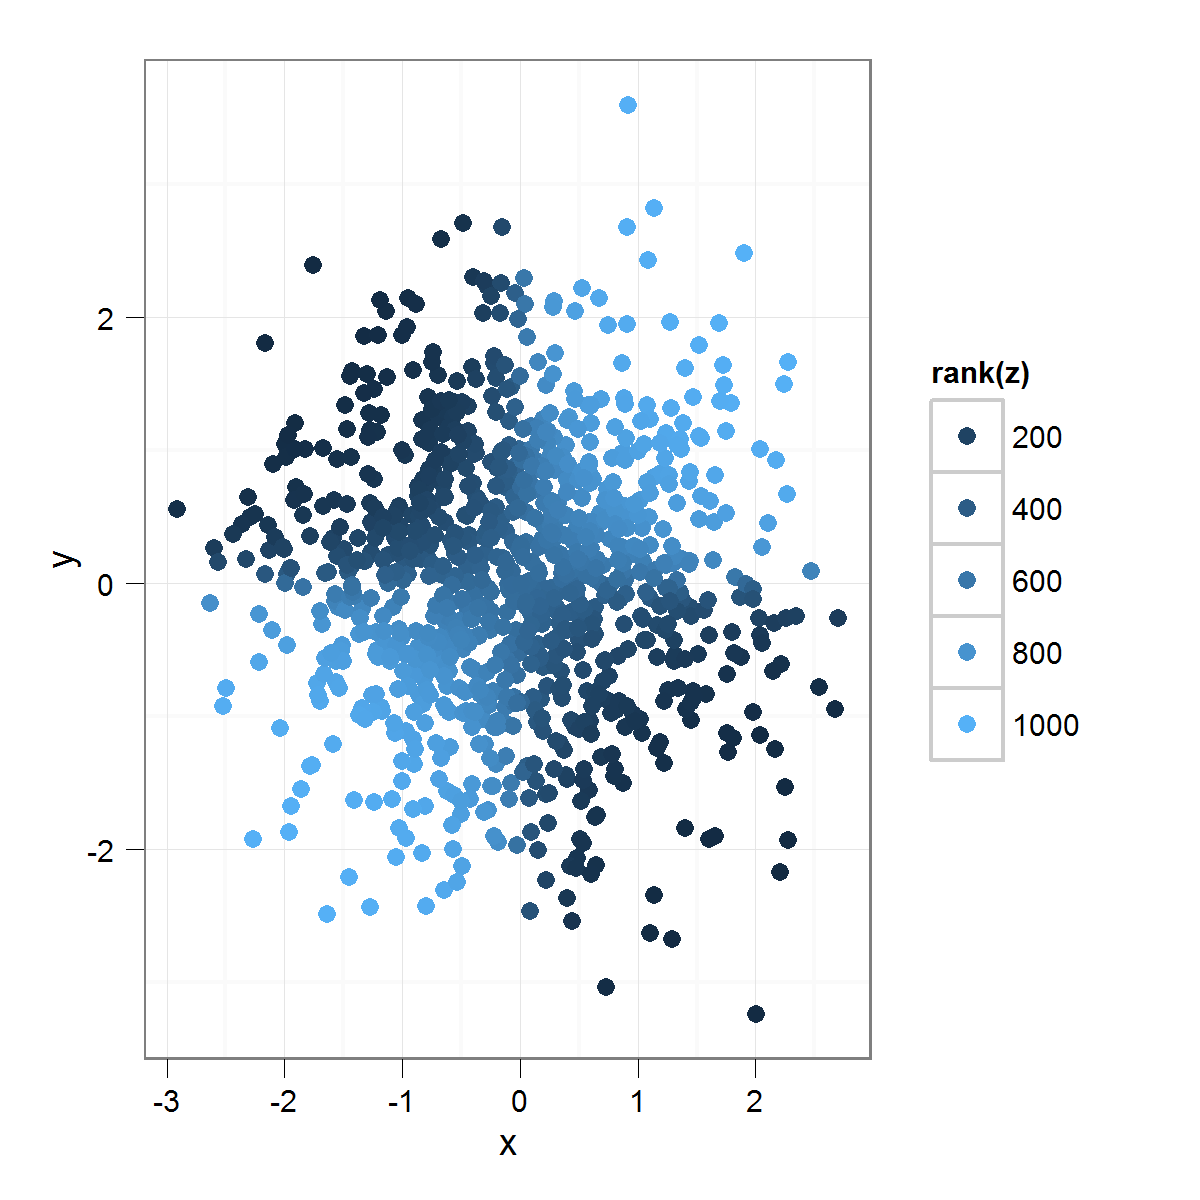
By applying rank() to the "z" variable, I get a much greater emphasis on minor differences within the "z" variable. One could imagine using any transformation here, instead of rank, but you get the idea.
My question is, essentially, what is the most straightforward way, or the most "true ggplot2" way, of getting a legend in the original units (units of z, as opposed to the rank of z), while maintaining the transformed version of the colored points?
I have a feeling this uses rescaler() somehow, but it is not clear to me how to use rescaler() with arbitrary transformations, etc. In general, more clear examples would be useful.
Thanks in advance for your time.
Upvotes: 16
Views: 3031
Answers (1)

Reputation: 115435
Have a look at the package scales
especially
?trans
I think that a transformation that maps the colour given the probability of getting the value or more extreme should be reasonable (basically pnorm(z))
I think that scale_colour_continuous(trans = probability_trans(distribution = 'norm') should work, but it throws warnings.
So I defined a new transformation (see ?trans_new)
I have to define a transformation and an inverse
library(scales)
norm_trans <- function(){
  trans_new('norm', function(x) pnorm(x), function(x) qnorm(x))
}

badVersion + geom_point() + scale_colour_continuous(trans = 'norm'))

Using the supplied probability_trans throws a warning and doesn't seem to work
# this throws a warning
badVersion + geom_point+
  scale_colour_continuous(trans = probability_trans(distribution = 'norm'))

## Warning message:
## In qfun(x, ...) : NaNs produced

Upvotes: 10
Related Questions
- ggplot legend not working with scale_colour_manual
- How to adjust scale of ggplot legend when saturating color
- ggplot2: Fix legend for logarithmic color scale
- Set colour and scale of legend
- ggplot2: Mixing of labels and colours using scale_colour_manual
- Faulty legend in R with "color_scale_manual"
- Color coding and legend labels in ggplot
- How to combine scales for colour and size into one legend?
- change the scale manually and legend labels to reflect intervals
- R: control scale in ggplot2's legend