
Reputation: 29163
How do I debug Node.js applications?
How do I debug a Node.js server application?
Right now I'm mostly using alert debugging with print statements like this:
sys.puts(sys.inspect(someVariable));
There must be a better way to debug. I know that Google Chrome has a command-line debugger. Is this debugger available for Node.js as well?
Upvotes: 1715
Views: 557724
Answers (30)

Reputation: 172
Please try interesting way to debug Node.js applications (not only) using Smart logs
https://github.com/darky/the-most-convenient-debug
Upvotes: 1

Reputation: 755
Exclusive for VS code developers using node js. Enable inbuilt debug
file > preferences > settings > in search box type "autoattach" and set how debugger should attach [preferred onlyWithFlag]

say magic, and you should see

run node program with --inspect you should vs code doing her job :)
Tip: you can also run without --inspect by enabling always filter
Upvotes: 0

Reputation: 24770
With an IDE
In WebStorm you can just open your package.json file and run the scripts in DEBUG mode from there. Just click the green play-buttons on the side.

with --inspect
If you would debug an application directly from the CLI without an IDE, then you could run your script like node index.js --inspect. By default it will then listen on port 5858 allowing you to connect a debugger. Alternatively you can specify a different port with --inspect=5858.
with an environment variable
- Create a script
myInspector.jsthat looks like this:
let inspector = require("inspector");

// you could explicitly specify a port.
// or alternatively set it to 0 to get any available port.
const port = 0;
inspector.open(port, undefined, true);

// print the url which also reveals the port.
const url = inspector.url()
console.log(url);
- Set an environment variable
NODE_OPTIONS="--require myInspector.js" - Launch your script.
In fact, that's also how WebStorm injects the inspector. The beauty is that it works no matter which launcher you use. So you can just npm run ..., node-ts ... or even use some .sh/.bat file.
Upvotes: 1

Reputation: 2418
This method is valid to JS also Node js. It is put debugger word that you want to check. When running your JS or Node js app open the inspect element in the browser. If reach that line execution will pause like the below image.

Upvotes: 3

Reputation: 8826
You can try-catch errors:
function yourFunc() {
  try {
      // YOUR CODE HERE
  } catch (err) {
      console.error(err.message + ", " + err.trace);
  }
}
Error message and error trace will give you infomation you need to identify and correct run-time bugs.
Upvotes: 1

Reputation: 51
Another option not mentioned in other answers is using a tool called Rookout. It's used to debug and get data from both local and remote apps. We use it in our production environment to aggregate data to other services - saves us a lot of headaches and hardcoded logging
Upvotes: 3

Reputation: 207
I created a neat little tool called pry.js that can help you out.
Put a simple statement somewhere in your code, run your script normally and node will halt the current thread giving you access to all your variables and functions. View/edit/delete them at will!
var pry = require('pryjs')

class FizzBuzz

  run: ->
    for i in [1..100]
      output = ''
      eval(pry.it) // magic
      output += "Fizz" if i % 3 is 0
      output += "Buzz" if i % 5 is 0
      console.log output || i

  bar: ->
    10

fizz = new FizzBuzz()
fizz.run()
Upvotes: 17

Reputation: 320
Enable VS Code preference Auto Attach from File -> Preferences -> Settings -> Search for Auto Attach and set it On, open the console (ctrl + *) or from the menu Terminal -> New Terminal, set a breakpoint in your code, type in the command
node --inspect <name of your file>
This will start the debugging and the VS Code will show the Debug menu.
Note: Auto Attach is also very helpful if you are working with node cluster worker threads.
Upvotes: 2

Reputation: 28339
Node has its own built in GUI debugger as of version 6.3 (using Chrome's DevTools)

Simply pass the inspector flag and you'll be provided with a URL to the inspector:
node --inspect server.js
You can also break on the first line by passing --inspect-brk instead.
Upvotes: 214

Reputation: 1384
There is a lot of ways to debug but I prefer and I use builtin debugger by node js.
app.js file
var fs = require('fs');

fs.readFile('test.txt', 'utf8', function (err, data) {

debugger;

if (err) throw err;

console.log(data); });
command: node debug app.js
Upvotes: 1

Reputation: 63992
There is the new open-source Nodeclipse project (as a Eclipse plugin or Enide Studio):

Nodeclipse became #1 in Eclipse Top 10 NEW Plugins for 2013. It uses a modified V8 debugger (from Google Chrome Developer Tools for Java).
Nodeclipse is free open-source software released at the start of every month.
Upvotes: 7

Reputation: 48709
Debugging
Profiling
node --prof ./app.jsnode --prof-process ./the-generated-log-file
Heapdumps
Flamegraphs
- 0x
- jam3/devtool then Chrome Developer Tools Flame Charts
- Dtrace and StackVis — Only supported on SmartOS
- clinicjs
Tracing
Logging
Libraries that output debugging information
Libraries that enhance stack trace information
Benchmarking
- Apache Bench:
ab -n 100000 -c 1 http://127.0.0.1:9778/ - wrk
Other
Legacy
These use to work but are no longer maintained or no longer applicable to modern node versions.
- https://github.com/bnoordhuis/node-profiler - replaced by built-in debugging
- https://github.com/c4milo/node-webkit-agent - replaced by node inspector
- https://nodetime.com/ - defunct
Upvotes: 796

Reputation: 10089
I put together a short Node.js debugging primer on using the node-inspector for those who aren't sure where to get started.
Upvotes: 11

Reputation: 1267
ndb is an improved debugging experience for Node.js, enabled by Chrome DevTools
https://github.com/GoogleChromeLabs/ndb
Upvotes: 4

Reputation: 2260
My original response was couple of years ago pre visual studio.
So, Using GOOD by hapi is a great logging package but for debugging use visual studio.
original response (some long time ago): I would use GOOD by Walmart Labs. It will do the job, and it's very flexible:
var hapi = require('hapi');
var good = require('good');
var server = hapi.createServer('localhost', 5000,{});
server.route({SOME ROUTE HERE});
server.start();

var options = {
subscribers: {
    'console':               ['ops', 'request', 'log', 'error'],
    'http://localhost/logs': ['log']
    }
};
server.pack.require('good', options, function (err) {

    if (!err) {
        console.log('Plugin loaded successfully');
    }
});
Upvotes: 2

Reputation: 506
Using Chrome Version 67.0.3396.62(+)
- Run node app
node --inspect-brk=0.0.0.0:9229 server.js(server js filename)
- Browse your app in chrome e.g. "localhost:port"
- Open DevTools.
- Click the the node icon beside the responsive device icon.

There will be another DevTools window that will pop out specifically for debugging node app.

Upvotes: 16

Reputation: 2783
You may use pure Node.js and debug the application in the console if you wish.
For example let's create a dummy debug.js file that we want to debug and put breakpoints in it (debugger statement):
let a = 5;
debugger;

a *= 2;
debugger;

let b = 10;
debugger;

let c = a + b;
debugger;

console.log(c);
Then you may run this file for debugging using inspect command:
node inspect debug.js
This will launch the debugger in the console and you'll se the output that is similar to:
< Debugger listening on ws://127.0.0.1:9229/6da25f21-63a0-480d-b128-83a792b516fc
< For help, see: https://nodejs.org/en/docs/inspector
< Debugger attached.
Break on start in debug.js:1
> 1 (function (exports, require, module, __filename, __dirname) { let a = 5;
  2 debugger;
  3
You may notice here that file execution has been stopped at first line. From this moment you may go through the file step by step using following commands (hot-keys):
contto continue,nextto go to the next breakpoint,into step in,outto step outpauseto pause it
Let's type cont several times and see how we get from breakpoint to breakpoint:
debug> next
break in misc/debug.js:1
> 1 (function (exports, require, module, __filename, __dirname) { let a = 5;
  2 debugger;
  3
debug> next
break in misc/debug.js:2
  1 (function (exports, require, module, __filename, __dirname) { let a = 5;
> 2 debugger;
  3
  4 a *= 2;
debug> next
break in misc/debug.js:4
  2 debugger;
  3
> 4 a *= 2;
  5 debugger;
  6
What we may do now is we may check the variable values at this point by writing repl command. This will allow you to write variable name and see its value:
debug> repl
Press Ctrl + C to leave debug repl
> a
5
> b
undefined
> c
undefined
>
You may see that we have a = 5 at this moment and b and c are undefined.
Of course for more complex debugging you may want to use some external tools (IDE, browser). You may read more here.
Upvotes: 4
Reputation: 29163
The V8 debugger released as part of the Google Chrome Developer Tools can be used to debug Node.js scripts. A detailed explanation of how this works can be found in the Node.js GitHub wiki.
Upvotes: 269

Reputation: 87
There are may ways to debug Node.JS application as follows:
1) Install devtool and start application with it
npm install devtool -g --save
devtool server.js
this will open in chrome developer mode so you can put a debugger point and test.
2) debug with node-inspector
node-inspector
3) debug with --debug
node --debug app.js
Upvotes: 0

Reputation: 1659
Use this commands
DEBUG_LEVEL=all node file.js
DEBUG=* node file.js
node file.js --inspect
Upvotes: 4

Reputation: 5229
Start your node process with --inspect flag.
node --inspect index.js
and then Open chrome://inspect in chrome. Click the "Open dedicated DevTools for Node" link or install this chrome extension for easily opening chrome DevTools.
For more info refer to this link
Upvotes: 8


Reputation: 4266
A lot of great answers here, but I'd like to add my view (based on how my approach evolved)
Debug Logs
Let's face it, we all love a good console.log('Uh oh, if you reached here, you better run.') and sometimes that works great, so if you're reticent to move too far away from it at least add some bling to your logs with Visionmedia's debug.
Interactive Debugging
As handy as console logging can be, to debug professionally you need to roll up your sleeves and get stuck in. Set breakpoints, step through your code, inspect scopes and variables to see what's causing that weird behaviour. As others have mentioned, node-inspector really is the bees-knees. It does everything you can do with the built-in debugger, but using that familiar Chrome DevTools interface. If, like me, you use Webstorm, then here is a handy guide to debugging from there.
Stack Traces
By default, we can't trace a series of operations across different cycles of the event loop (ticks). To get around this have a look at longjohn (but not in production!).
Memory Leaks
With Node.js we can have a server process expected to stay up for considerable time. What do you do if you think it has sprung some nasty leaks? Use heapdump and Chrome DevTools to compare some snapshots and see what's changing.
For some useful articles, check out
If you feel like watching a video(s) then
- Netflix JS Talks - Debugging Node.js in Production
- Interesting video from the tracing working group on tracing and debugging node.js
- Really informative 15-minute video on node-inspector
Whatever path you choose, just be sure you understand how you are debugging

It is a painful thing
To look at your own trouble and know
That you yourself and no one else has made itSophocles, Ajax
Upvotes: 46

Reputation: 11841
There are many possibilities...
- node includes a debugging utility
- node-inspector
- Code editors / IDEs (see debug instructions for one of the following)
Debug support is often implemented using the v8 Debugging Protocol or the newer Chrome Debugging Protocol.
Upvotes: 6

Reputation: 68403
There is built-in command line debugger client within Node.js. Cloud 9 IDE have also pretty nice (visual) debugger.
Upvotes: 13

Reputation: 1937
Visual Studio Code will be my choice for debugging. No overhead of installing any tools or npm install stuff.
Just set the starting point of your app in package.json and VSCode will automatically create a configuration file inside your solution. It's build on Electron, on which editors like Atom are built.
VS Code gives similar debugging experience as you might have had in other IDEs like VS, Eclipse, etc.


Upvotes: 77

Reputation: 1753
Use Webstorm! It's perfect for debugging Node.js applications. It has a built-in debugger. Check out the docs here: https://www.jetbrains.com/help/webstorm/2016.1/running-and-debugging-node-js.html
Upvotes: 9

Reputation: 3497
I wrote a different approach to debug Node.js code which is stable and is extremely simple. It is available at https://github.com/s-a/iron-node.
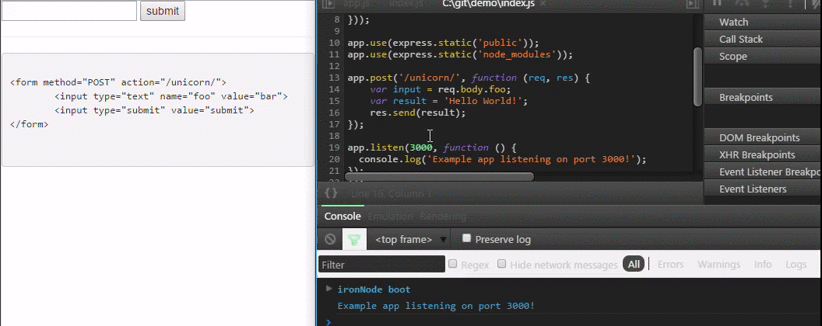
An opensource cross-platform visual debugger.
Installation:
npm install iron-node -g;
Debug:
iron-node yourscript.js;
Upvotes: 24

Reputation: 13733
node-inspector could save the day! Use it from any browser supporting WebSocket. Breakpoints, profiler, livecoding, etc... It is really awesome.
Install it with:
npm install -g node-inspector
Then run:
node-debug app.js
Upvotes: 1310

Reputation: 18116
The NetBeans IDE has had Node.js support since version 8.1:
<...>
New Feature Highlights
Node.js Application Development
- New Node.js project wizard
- New Node.js Express wizard
- Enhanced JavaScript Editor
- New support for running Node.js applications
- New support for debugging Node.js applications.
<...>
Additional references:
Upvotes: 4
Related Questions
- How to debug node js app with breakpoints and everything?
- Can't debug node.js using Chrome DevTools
- How to debug remote node.js app using chrome devtools
- How to debug Node.js with Firefox?
- How to debug Node.js based web application
- How do you debug a Node.js server running with Chrome/WebKit as the remote debugger?
- Debugging local nodejs script in chrome dev tools
- How to really debug node.js app?
- Debugging in node.js
- how do you debug a node.js app?