
Reputation: 29654
What is the best way to profile a view in Django?
I have developed an application using Django and everything is working fine but I don't know what's going on behind the scenes. I would like to know:
- How many times the database is being hit for each request?
- What was the execution time for each query?
- How long it took to render the template?
- Regular profiling info (ncalls, tottime per function).
Is there a Middleware to handle this that I could install? Which are the best practices to profile my views?
Thanks
Upvotes: 3
Views: 2714
Answers (4)

Reputation: 5891
For people arriving in 2019+, django-debug-toolbar is still great, but just as a heads-up, most of the template profiling panes are broken in modern Django versions (2.0+).
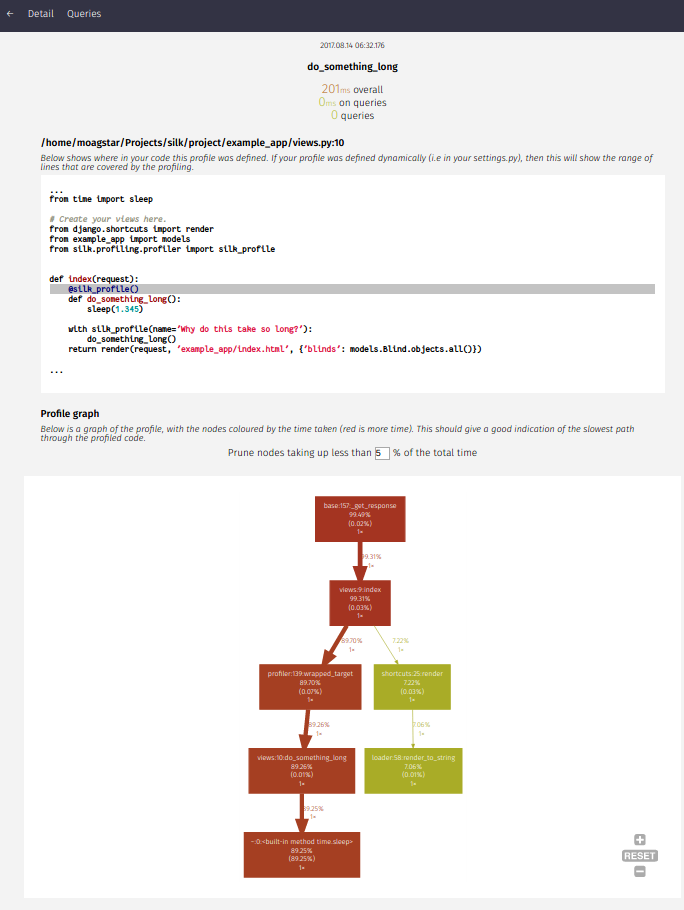
Another good option these days is django-silk which has some beautiful timing profile visualization and graphing features, and django-live-profiler with a working fork for Django v2.0+ here.

Upvotes: 0

Reputation: 43932
The one project that meets all your requirements, with the exception of profiling, is the excellent django debug toolbar.
For standard profiling you need to use repoze.profile (which means you have to be running Django with WSGI interface such as mod_wsgi).
If you're hardcore and need to debug memory leaks use dozer (also a WSGI component).
Upvotes: 3


Reputation: 34014
{% if debug %}
    <div id="debug">
    <h2>Queries</h2>
    <p>
        {{ sql_queries|length }} Quer{{ sql_queries|pluralize:"y,ies" }}
        {% ifnotequal sql_queries|length 0 %}
        (<span style="cursor: pointer;" onclick="var s=document.getElementById('debugQueryTable').style;s.display=s.display=='none'?'':'none';this.innerHTML=this.innerHTML=='Show'?'Hide':'Show';">Show</span>)
        {% endifnotequal %}
    </p>
    <table id="debugQueryTable" style="display: none;">
        <col width="1"></col>
        <col></col>
        <col width="1"></col>
        <thead>
        <tr>
        <th scope="col">#</th>
        <th scope="col">SQL</th>
        <th scope="col">Time</th>
        </tr>
        </thead>
        <tbody>
        {% for query in sql_queries %}<tr class="{% cycle odd,even %}">
        <td>{{ forloop.counter }}</td>
        <td>{{ query.sql|escape }}</td>
        <td>{{ query.time }}</td>
        </tr>{% endfor %}
        </tbody>
    </table>
    </div>
{% endif %}
Django Snippet: Template Query Debug
Upvotes: 0
Related Questions
- Is there a way to profile my Django application?
- Optimize multiple Views to one View - Django
- How to profile django application with respect to execution time?
- Performance issues with Django
- Profiling Django views line-by-line
- benchmarking django apps
- how to do profiling a python project as a whole?
- How to profile a running Django application?
- How to check the performance of a django application?
- how to perform profiling for a website?