
Reputation: 380
Highcharts Grouped Column with Time Series
I know how to make the regular columns in highcharts that are grouped and I know how to make a time series for a line chart OR columns (they have examples for these), but what I can't seem to figure out is how to create a time series for grouped columns. The closest I can get is overlapping columns.
I'm looking for something like this (made in paint):
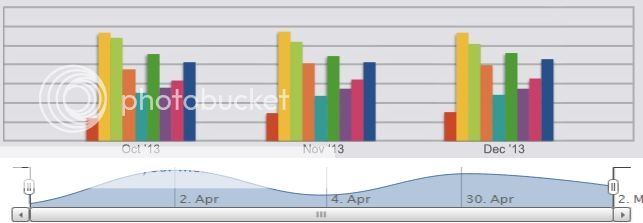 (https://i467.photobucket.com/albums/rr40/hosoi_dan/grouped_column_time_series_zpsbd2afb7d.jpg)
Here's what my code looks like: `
var data =
[
    /* Apr 2013 */
    {name:"T1",x:1364774400000, y:13918927, color:"red"},
    {name:"T1",x:1364774400000, y:10920462, color:"green"},
    [1364860800000,18920462],
    [1364947200000,12971961],

    /* May 2013 */
    [1367366400000,18112671],
    [1367452800000,15072312]
];


$('#container').highcharts('StockChart', {
    chart: {
        alignTicks: false,
            type: 'column'
    },
    rangeSelector: {
        selected: 1
    },
    title: {
        text: 'AAPL Stock Volume'
    },

    series: [{
        name: 'AAPL Stock Volume',
        data: data
    }]
});
`
And a jsfillde with the code: http://jsfiddle.net/UH5wj/
Upvotes: 0
Views: 3001
Answers (2)

Reputation: 45079
This is general idea: http://jsfiddle.net/wFpey/
So split data into series according to name. Then create array of points, where each point is object or array (my example is array).
var series = [ {
    name: "T1",
    data: [
        [1364774400000, 13918927], [1364974400000, 13918927]
    ],
    color: "red"
}, {
    name: "T2",
    data: [
        [1364774400000,10920462], [1364974400000, 13918927]
    ],
    color: "green"
}, {
    name: "T3",
    data: [
        [1364774400000, 12312312], [1364974400000, 13918927]
    ],
    color: "blue"
}, {
    name: "T4",
    data: [
        [1364774400000, 12311111], [1364974400000, 13918927]
    ],
    color: "yellow"
}, {
    name: "T5",
    data: [
        [1364774400000, 11233345], [1364974400000, 13918927]
    ],
    color: "gray"
}, {
    name: "T6",
    data: [
        [1364774400000, 14322311]
    ],
    color: "black"
}];
Upvotes: 2

Reputation: 656
Without seeing how your data is coming in, I can only get you so far, but take a look at this. The two keys here are the spacing between series points, taken care of in the plotOptions section, and defining categories on the xAxis to be grouped in. Fiddle
$(function() {

var data =
[
/* Apr 2013 */
{name:"T1",x:1364774400000, y:13918927, color:"red"},
{name:"T1",x:1364774400000, y:10920462, color:"green"},
[1364860800000,18920462],
[1364947200000,12971961],
/* May 2013 */
[1367366400000,18112671],
[1367452800000,15072312]
];
    /*$.getJSON('http://www.highcharts.com/samples/data/jsonp.php?filename=aapl-      v.json&callback=?', function(data) {*/

    // create the chart
    $('#container').highcharts('StockChart', {
        chart: {
            alignTicks: false,
            type: 'column'
        },

        plotOptions: {
        series: {
            pointPadding: 0,
            groupPadding: 0,
            borderWidth: 0,
            shadow: false
            }
        },
        rangeSelector: {
            selected: 1
        },

        title: {
            text: 'AAPL Stock Volume'
        },

        series: [{
            name: 'AAPL Stock Volume',
            data: data
        }],
        xAxis: {
            categories: ['Apr 2013', 'May 2013'] ///needs to be specific to your data, this is just an idea not knowing your data
        },
    });
//});
});
EDIT: saw your data up top after, needs some tweaking a bit, but I hope you get the idea
Upvotes: 0
Related Questions
- I'm trying to create a timeseries chart having stacked columns in HighCharts
- Multiple time series in stacked column chart
- Grouped and stacked columns with shared series
- Highcharts - how to create multiple y axis and group the data series
- Highcharts Grouped Column Chart with Multiple Groups?
- Highcharts x series group
- Highcharts Grouped Data In Subgroup
- Multiple columns on same series. Highchart
- line and column chart in grouped categories in highcharts
- HighCharts: column grouped drill down