
Reputation: 1311
Tick labels in ggplot2 bar graph
I have a simple dataframe, by_day, that I'd like to plot out:
 X weekday         variable value
0       0 Number_of_tweets  5820
1       1 Number_of_tweets  6965
2       2 Number_of_tweets  7415
3       3 Number_of_tweets  6800
4       4 Number_of_tweets  5819
5       5 Number_of_tweets  1753
6       6 Number_of_tweets  1137
I can get the basic plot without any problem.
daily_plot <- ggplot(data=by_day, aes(x=by_day$weekday, y=by_day$value)) +
  geom_bar(stat = "identity")
The issue comes when I try to modify the value labels. If I do this I end up with extra space on the right-hand side of the x-axis:
daily_plot +
  scale_x_discrete("Day of the Week", breaks = c("0","1","2","3","4","5","6"), labels=c("Mon","Tues","Wed","Th","Fri","Sat","Sun"))

And if I do this, then the issue is the bars and the new labels are offset
daily_plot +
  scale_x_discrete("Day of the Week", breaks = c("0","1","2","3","4","5","6"),    labels=c("Mon","Tues","Wed","Th","Fri","Sat","Sun"), limits=c("0","1","2","3","4","5","6")) +
  theme(axis.title.x = element_text(vjust=-0.5), axis.title.y=element_text(vjust=0.1))

I've spent some good time going over the ggplot2 documentation as well as StackOverflow but can't find the same issue. Any help would be appreciated.
Upvotes: 10
Views: 41965
Answers (1)

Reputation: 78832
Try using a continuous scale instead (since you're not using factors):
by_day <- data.frame(
  X=0:6,
  weekday=0:6,
  variable="Number_of_tweets",
  value=c(5820,6965,7415,6800,5819,1753,1137))

print(by_day)

##   X weekday         variable value
## 1 0       0 Number_of_tweets  5820
## 2 1       1 Number_of_tweets  6965
## 3 2       2 Number_of_tweets  7415
## 4 3       3 Number_of_tweets  6800
## 5 4       4 Number_of_tweets  5819
## 6 5       5 Number_of_tweets  1753
## 7 6       6 Number_of_tweets  1137

daily_plot <- ggplot(data=by_day, aes(x=weekday, y=value))
daily_plot <- daily_plot + geom_bar(stat = "identity")
daily_plot <- daily_plot + scale_x_continuous(breaks=0:6,
                                              labels=c("Mon","Tue","Wed","Thu","Fri","Sat","Sun"))
print(daily_plot)
(per commenter you can and should just use column names w/o $ and my group= wasn't necessary [force of habit on my part]).
Also:
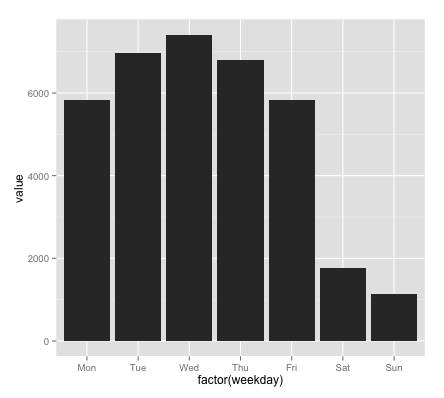
daily_plot <- ggplot(data=by_day, aes(x=factor(weekday), y=value))
daily_plot <- daily_plot + geom_bar(stat = "identity")
daily_plot <- daily_plot + scale_x_discrete(breaks=0:6,
                                            labels=c("Mon","Tue","Wed","Thu","Fri","Sat","Sun"))
print(daily_plot)
works fine (factor() for x lets you use scale_x_discrete)
Upvotes: 19
Related Questions
- How to change the tick labels on an axis
- How to label a bar chart in ggplot2
- How to add labels into the bars in a bar graph using ggplot2 in R?
- ggplot2 for bar plot with two same tick labels
- Adding labels to ggplot bar chart
- Placing tick marks between bars in ggplot2
- Labels on bar chart ggplot2 R
- ggplot x-axis tick marks labels
- add axis ticks and labels in ggplot2 r
- Add ticks without labels on the top of a bar plot in ggplot2