Alex I
Reputation: 20287
Matplotlib equivalent to ggplot geom_ribbon?
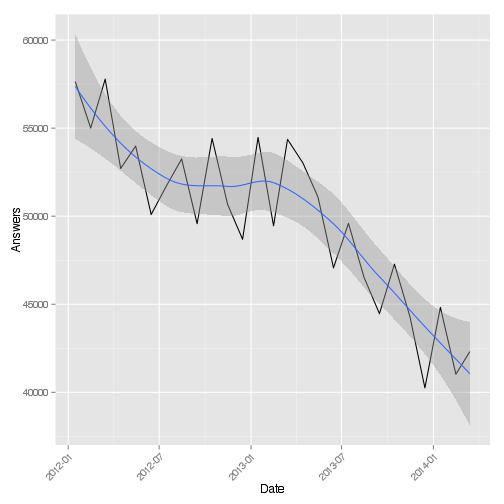
I would like to reproduce the ggplot style of showing a confidence interval around a value with a ribbon, like geom_ribbon or geom_smooth.
I tried calculating the confidence interval separately and plotting with fill_between() which is close but doesn't seem exactly right. How can the x axis be the style that comes from plot_date() while using fill_between()? What about smoothing of the ribbon?
Example output:


The ggplot code looks like this (several found examples):
qplot(wt, mpg, data=mtcars, colour=factor(cyl)) +
  geom_smooth(aes(ymin = lcl, ymax = ucl), data=grid, stat="identity")

ggplot(answers.overall, aes(Date, Answers)) + geom_line() +
  geom_smooth(method="loess") + theme(axis.text.x = element_text(angle = 45, hjust = 1))
Upvotes: 3
Views: 3334
Answers (1)
Steve S
Reputation: 1053
Is there a reason why you can't use ggplot for Python? Because that would really simplify things a lot:
import ggplot as gg

mtcars = gg.mtcars
gg.qplot(mtcars.wt, mtcars.mpg) + gg.geom_smooth(color="blue")
Upvotes: 3
Related Questions
- How to use geom_ribbon to plot?
- How to use geom_ribbon()?
- How to add legend to geom_ribbon plot?
- Colouring geom_ribbon in ggplot2 & R
- How to graph with geom_ribbon
- R ggplot2: Display Ribbon Area on Graph
- extend ggplot `geom_ribbon()` in the x direction
- ggplotly with geom_ribbon grouping
- Controlling rectangular geom_ribbon in R ggplot
- inverse X and Y axis using geom_ribbon in ggplot2