
Reputation: 95
How to display total of extra data in stacked column high charts
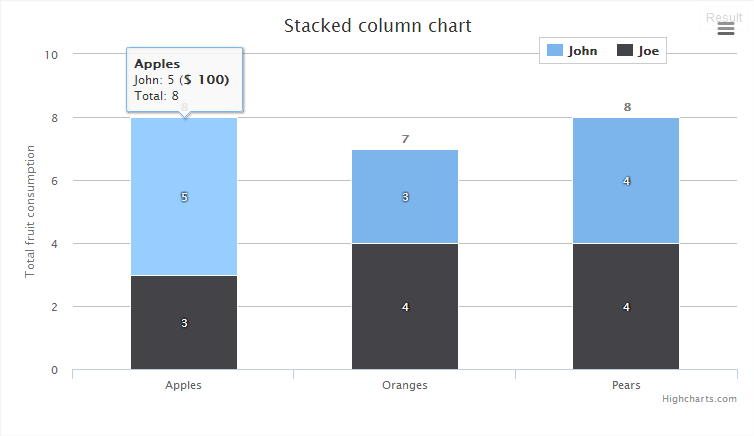
I have a stacked column showing the number of certain fruits eaten by John and Joe. Aside from the number of fruits, I also like to show how much the cost of their fruit consumption is. In my case, I can now show the amount of each fruit eaten by John or Joe (ex. John ate 5 apples for $100 while Joe ate 3 apples for $60). However, I would also like to show their total cost per fruit (for the apples, total consumption is 8 apples worth $160). Is there a way that I can do this?
You can see my preliminary work here: http://jsfiddle.net/SpzBa/
$(function () {
    $('#container').highcharts({
        chart: {
            type: 'column'
        },
        title: {
            text: 'Stacked column chart'
        },
        xAxis: {
            categories: ['Apples', 'Oranges', 'Pears']
        },
        yAxis: {
            min: 0,
            title: {
                text: 'Total fruit consumption'
            },
            stackLabels: {
                enabled: true,
                style: {
                    fontWeight: 'bold',
                    color: (Highcharts.theme && Highcharts.theme.textColor) || 'gray'
                }
            }
        },
        legend: {
            align: 'right',
            x: -70,
            verticalAlign: 'top',
            y: 20,
            floating: true,
            backgroundColor: (Highcharts.theme && Highcharts.theme.background2) || 'white',
            borderColor: '#CCC',
            borderWidth: 1,
            shadow: false
        },
        tooltip: {
            formatter: function() {
                return '<b>'+ this.x +'</b><br/>'+
                    this.series.name +': '+ this.y + ' (<b>$ ' + this.point.Amount +') <br/>'+
                    'Total: '+ this.point.stackTotal;
            }
        },
        plotOptions: {
            column: {
                stacking: 'normal',
                dataLabels: {
                    enabled: true,
                    color: (Highcharts.theme && Highcharts.theme.dataLabelsColor) || 'white',
                    style: {
                        textShadow: '0 0 3px black, 0 0 3px black'
                    }
                }
            }
        },
        series: [{
            name: 'John',
            data: [{y: 5, Amount: 100}, {y: 3, Amount: 60}, {y: 4, Amount: 80}]
        }, {
            name: 'Joe',
            data: [{y: 3, Amount: 60}, {y: 4, Amount: 80}, {y: 4, Amount: 80}]
        }]
    });
});

(source: rackcdn.com)
Is it possible to show the total amount per fruit consumed? Say put the total amount beside "Total" label when hovering a column. Ex. in the figure, "Total: 8 ($160)".
Thank you very much!
Upvotes: 1
Views: 2018
Answers (1)

Reputation: 7095
It's a bit round the houses but you can get an array of all the series with this.series.chart.series, and each series has a points array which you can use your current this.point.x as an index to, so by iterating all the series you can calculate a total for your Amount property.
tooltip: {
    formatter: function() {
        var allSeries = this.series.chart.series;
        var totalAmount = 0;
        for(var s in allSeries) { totalAmount += allSeries[s].points[this.point.x].Amount; }

        return '<b>'+ this.x +'</b><br/>'+
            this.series.name +': '+ this.y + ' (<b>$ ' + this.point.Amount +') <br/>'+
            'Total: '+ this.point.stackTotal + ' (<b>$ ' + totalAmount +')';
    }
}
Upvotes: 4
Related Questions
- highcharts graph with one regular column and one stacked column
- Stacked Bar Highcharts how to show the values
- How to add different series data for each categories in Stacked Column chart in Highcharts?
- How to make stacked column graph to show total data value on top
- Adding Total Column to Highcharts column range
- Highcharts stacked column: show total when a stack is hidden
- Stacked value with line chart with highcharts
- Show total for whole group in Highcharts 'stacked & grouped column' layout
- Want Stacked column highchart to represent data in two column
- How to display a single series total in stackLabels