Reputation: 201
Plotting more than 2 series on a figure (matplotlib plot_date() )
I have a similar question to the one posted here: Multiple data set plotting with matplotlib.pyplot.plot_date
and this worked for me, but I want to plot more than 2 plots on the same figure.
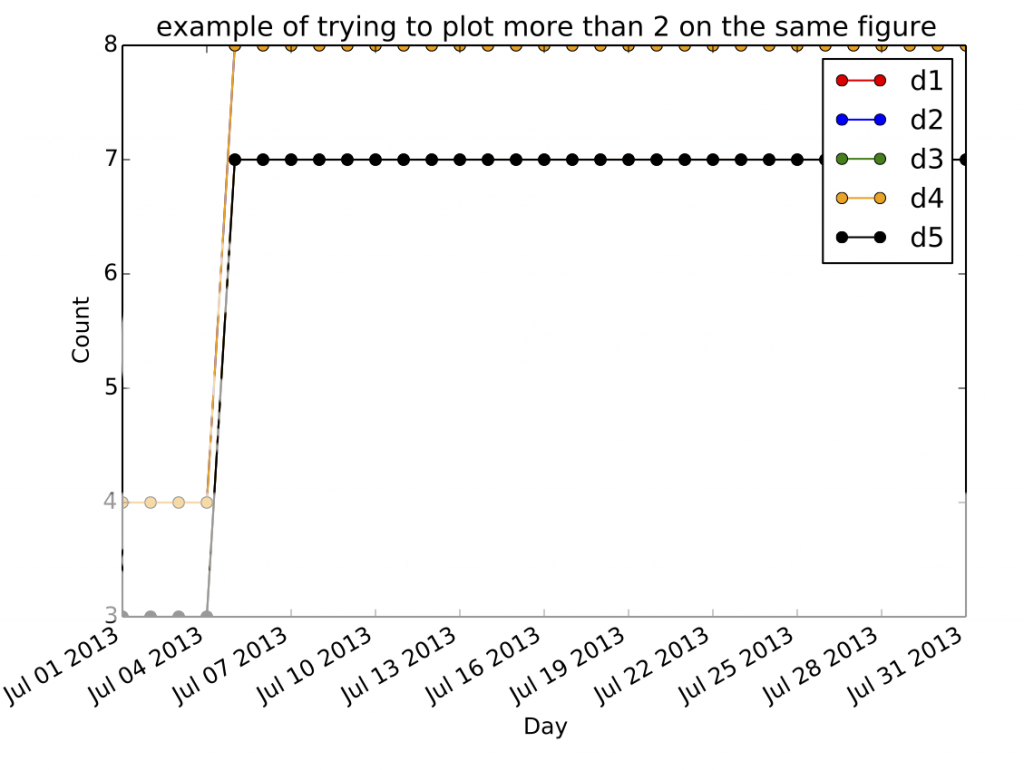
In my case, for example, if I call the plot_date() function 5 times, the resulting graph shows the points/lines for the last two calls, but the first three calls, the lines are not plotted BUT all 5 appear in the legend (I differentiate each by a different color and label in each of the 5 calls).
The overview is I am using python, opening a csv text file with the data (series label, date, count (y)) into a list of tuples, then putting this list into a pandas dataframe. Then I pivot it to change it to
df = df.pivot(index='date', columns='series', values='count')
Then my code for plotting:
fig = plt.figure()
plt.plot_date(x=df.index, y=df['series1'], fmt='bo-', tz=None, xdate=True,
      ydate=False, label="d1", color='red')

plt.plot_date(x=df.index, y=df['series2'], fmt='bo-', tz=None, xdate=True,
      ydate=False, label="d2", color='blue')

plt.plot_date(x=df.index, y=df['series3'], fmt='bo-', tz=None, xdate=True,
      ydate=False, label="d3", color='green')

plt.plot_date(x=df.index, y=df_date_domain['series4'], fmt='bo-', tz=None, xdate=True,
      ydate=False, label="d4", color='orange')

plt.plot_date(x=df.index, y=df_date_domain['series5'], fmt='bo-', tz=None, xdate=True,
      ydate=False, label="d5", color='black')

fig.autofmt_xdate()
plt.legend()
plt.xlabel("Day")
plt.ylabel("Count")
plt.title("example of trying to plot more than 2 on the same figure")
fname='test.pdf'
plt.savefig(fname)
Below is the result

Below is the full code followed by the text input (python test_plot.py plot_test.csv )
import sys
import pandas as pd
from ggplot import *
import matplotlib.pyplot as plt


def main(argv=sys.argv):
   if len(sys.argv) != 2:
        print sys.argv[0], "CSVinputFile (path if not in current dir)"
        sys.exit(-2)

inFileName = sys.argv[1]
qname_list = []
print inFileName


with open(inFileName, 'Ur') as fp:
    data_list = [tuple(line.strip().split(",")) for line in fp]


header_row=['series','date','count']
df = pd.DataFrame.from_records(data_list,columns=header_row)
df['date'] = pd.to_datetime(df['date'])

print df.head(10)
df = df.pivot(index='date', columns='series', values='count')

print df.head(10)
print df.describe()


#extract the columns out of the data to plot out
series_2_extract = ['series1', 'series3', 'series2']
#d_data = df[[series_2_extract]]  #doesnt work TypeError: unhashable type: 'list'
d_data = df[['series1', 'series3', 'series2']]
print d_data


#below works, can use a loop to iterate the list and call plot_date for each item in the list,
#but only last two series are showing on the plot

fig = plt.figure()
plt.plot_date(x=df.index, y=df['series1'], fmt='bo-', tz=None, xdate=True,
      ydate=False, label="d1", color='red')

plt.plot_date(x=df.index, y=df['series2'], fmt='bo-', tz=None, xdate=True,
      ydate=False, label="d2", color='blue')

plt.plot_date(x=df.index, y=df['series3'], fmt='bo-', tz=None, xdate=True,
      ydate=False, label="d3", color='green')

plt.plot_date(x=df.index, y=df['series4'], fmt='bo-', tz=None, xdate=True,
      ydate=False, label="d4", color='orange')

plt.plot_date(x=df.index, y=df['series5'], fmt='bo-', tz=None, xdate=True,
      ydate=False, label="d5", color='black')

fig.autofmt_xdate()
plt.legend()
plt.xlabel("Day")
plt.ylabel("Count")
plt.title("example of trying to plot more than 2 on the same figure")
fname='test.pdf'
plt.savefig(fname)

return 0

if __name__ == '__main__':
    sys.exit(main())
Since the text input is long, I have it here at pastebin http://pastebin.com/hmCUabvu and the above code is also here at pastebin: http://pastebin.com/07TNYie4
Upvotes: 1
Views: 3163
Answers (1)
Reputation: 3240
Because the data is the same. Your lines are plotted on top of each other.
>>> np.all(df['series1'] == df['series5'])
True
>>> np.all(df['series1'] == df['series3'])
True
>>> np.all(df['series2'] == df['series4'])
True
Upvotes: 1
Related Questions
- matplotlib graphing two series data on same graph with dates as x-axis
- Matplotlib Single Plot Multiple Time Series Same X Axis Days of Month
- Multiple data set plotting with matplotlib.pyplot.plot_date
- Python line plot multiple time series on same plot
- dates as series in matplotlib
- Plotting dates with matplotlib
- Python Matplotlib - Multiple series in same data file
- How can I plot two different spaced time series on one same plot in Python
- plotting multiple time series, with single date series and with py_date()
- I'm having trouble plotting date and two pieces of data on same graph with matplotlib