
jbest
Reputation: 640
igraph group vertices based on community
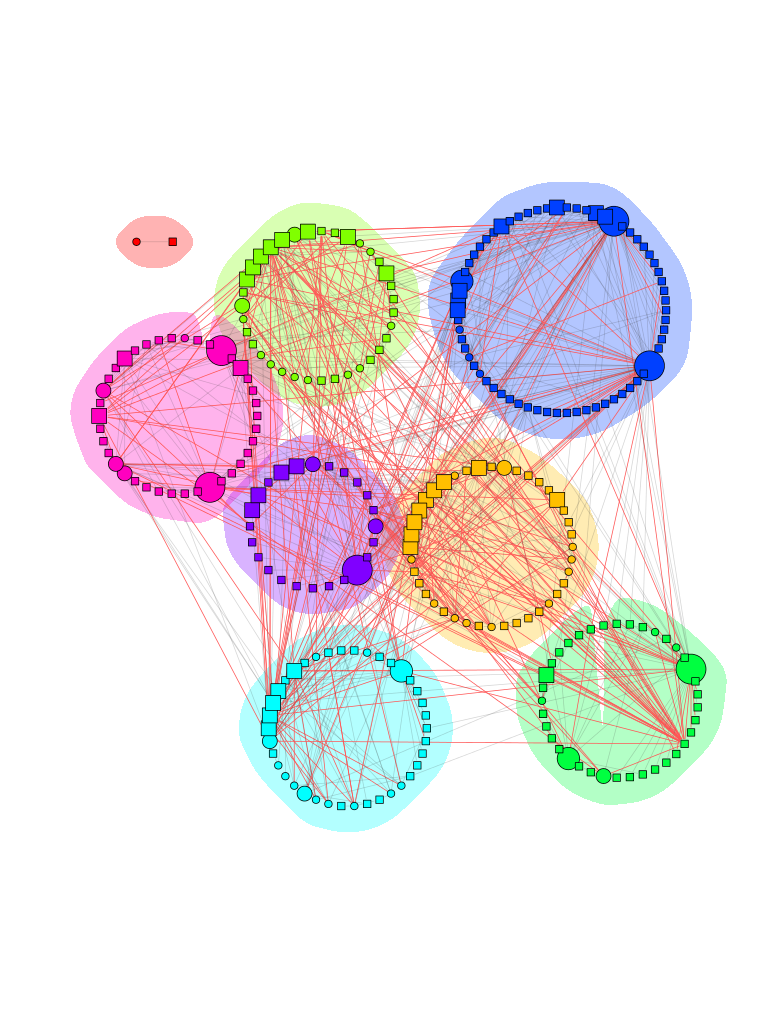
from my previous question here Creating Variables with Group in R igraph, I want to put the vertices with the same group/color close together in my type of data just like this one https://lists.nongnu.org/archive/html/igraph-help/2012-03/pngFA9V_3yRcA.png. Thanks in advance
Upvotes: 0
Views: 3182
Answers (1)

ahmohamed
Reputation: 2970
I have implemented such a function in my package NetPathMiner, called layoutVertexByAttribute.
library(igraph)
library(NetPathMiner)

g <- graph.data.frame(message)
g <- setAttribute(g, "sender", sender_country)

l = layoutVertexByAttr(g, "sender", cluster.strength=10, layout=layout.kamada.kawai)

plotNetwork(g, vertex.color="sender",layout=l)
You can look at the source code here or view the vignette for more details.

EDIT:
Since installing the package seems a bit difficult if you don't use Bioconductor, I will write a simpler version of the function here.
layout.by.attr <- function(graph, wc, cluster.strength=1,layout=layout.auto) {
        g <- graph.edgelist(get.edgelist(graph)) # create a lightweight copy of graph w/o the attributes.
        E(g)$weight <- 1

        attr <- cbind(id=1:vcount(g), val=wc)
        g <- g + vertices(unique(attr[,2])) + igraph::edges(unlist(t(attr)), weight=cluster.strength)

        l <- layout(g, weights=E(g)$weight)[1:vcount(graph),]
        return(l)
}
To use it with your example:
g <- graph.data.frame(message)

l = layoutVertexByAttr(g, sender_country, cluster.strength=10, layout=layout.kamada.kawai)

plot.igraph(g, vertex.color=sender_country, layout=l)
Upvotes: 3
Related Questions
- How can I plot igraph community with colors according to attributes?
- extract community membership after community detection in igraph (R)
- compare communities from graphs with different number of vertices
- generating a community graph in igraph
- Detect Networks/communities and assign IDs
- Extract edges between community nodes and other nodes
- Plot communities with igraph
- How to spread out community graph made by using igraph package in R
- how to create overlapping communities in igraph?
- plotting communities in iGraph