
Firkamon
Reputation: 807
R - getting box plot to work
boxplot(data=max_urkoma[[2]])
I have a data set max_urkoma[[2]] that I'd like to put into a box plot, but it won't show at all unless I give it the formula max_urkoma[[1]]~max_urkoma[[2]], and then it'll basically just become a set of points on a plot. What am I doing wrong? The plot is acting like every item in the data set is a separate object, I want them grouped together like in this one:
http://onlinestatbook.com/2/graphing_distributions/graphics/figure4.jpg
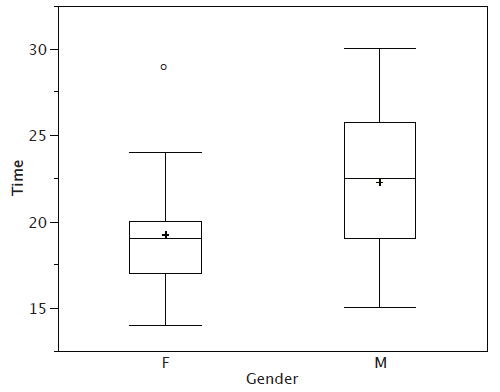
THis is how mine looks like https://i.sstatic.net/eJJNy.jpg
Upvotes: 0
Views: 138
Answers (1)

eipi10
Reputation: 93761
To get a single boxplot, you can do boxplot(mtcars$mpg), or with your data it looks like you need boxplot(max_urkoma[[2]]).
Upvotes: 1
Related Questions
- How can I split these boxplots according to a categorical variable?
- Having trouble making boxplots in R
- Boxplot (ggplot2) not working as expected
- Creating Boxplot in R
- Trying to make a box plot in R but it looks very odd
- ggplot boxplot - cannot get my plot to work, no 'box' plotted
- Having trouble setting up correctly a boxplot with ggplot
- Plotting a boxplot using R
- Boxplot in R function
- Box Plot In R Shows No Data