
Reputation: 849
How to visualize a neural network
I want to draw a dynamic picture for a neural network to watch the weights changed and the activation of neurons during learning. How could I simulate the process in Python?
More precisely, if the network shape is: [1000, 300, 50], then I wish to draw a three layer NN which contains 1000, 300 and 50 neurons respectively. Further, I hope the picture could reflect the saturation of neurons on each layer during each epoch.
I've no idea about how to do it. Can someone shed some light on me?
Upvotes: 34
Views: 51098
Answers (9)

Reputation: 559
Here is such a project for neural networks built with Keras (you can pip install kviz). You should be able to adapt this code for a different NN library without too many changes.
What I did not see in other answers which I wanted to add here are animations of the activations for different data points:

You can speed it up if you have many data points and visualize the activations before (left) and after (right) training:

all this is done with the animate_activations method here. This was really helpful for me to catch redundancies in the network architecture, dead neurons etc.
Upvotes: 3

Reputation: 10678
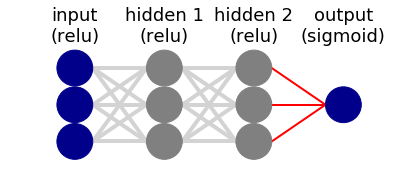
I was with that same problem and didn't find a good solution, so I created a library to do simple drawings. Here is an example on how to draw a 3-layer NN:
from nnv import NNV

layersList = [
    {"title":"input\n(relu)", "units": 3, "color": "darkBlue"},
    {"title":"hidden 1\n(relu)", "units": 3},
    {"title":"hidden 2\n(relu)", "units": 3, "edges_color":"red", "edges_width":2},
    {"title":"output\n(sigmoid)", "units": 1,"color": "darkBlue"},
]

NNV(layersList).render(save_to_file="my_example.png")
You can install that library by doing:
pip install nnv
And find more info about it at: https://github.com/renatosc/nnv/
Upvotes: 3

Reputation: 3043
This is how I did it:
- Head to the online graph creator by Alex : HERE
- Draw your
- shallow network (consisting of simply input-hidden-output layers) using FCNN (Fully connected Neural Network)
- Or deep/convolutional network using LeNet or AlexNet style.
This is what you'll have by now:

- Edit the svg file using the online tool at draw.io. For this, simply import the svg file into your workspace.This is how the end result should look like:

Upvotes: 1

Reputation: 1272
This solution involves both Python and LaTeX. Might be an overkill for your case, but the results are really aesthetic and suit more complicated, modern architectures (deep learning etc.), so I guess it is worth mentioning here. You first need to define your network in Python, such as this one:
import sys
sys.path.append('../')
from pycore.tikzeng import *

# defined your arch
arch = [
    to_head( '..' ),
    to_cor(),
    to_begin(),
    to_Conv("conv1", 512, 64, offset="(0,0,0)", to="(0,0,0)", height=64, depth=64, width=2 ),
    to_Pool("pool1", offset="(0,0,0)", to="(conv1-east)"),
    to_Conv("conv2", 128, 64, offset="(1,0,0)", to="(pool1-east)", height=32, depth=32, width=2 ),
    to_connection( "pool1", "conv2"),
    to_Pool("pool2", offset="(0,0,0)", to="(conv2-east)", height=28, depth=28, width=1),
    to_SoftMax("soft1", 10 ,"(3,0,0)", "(pool1-east)", caption="SOFT"  ),
    to_connection("pool2", "soft1"),
    to_end()
    ]

def main():
    namefile = str(sys.argv[0]).split('.')[0]
    to_generate(arch, namefile + '.tex' )

if __name__ == '__main__':
    main()
After that, you generate a TikZ image...
bash ../tikzmake.sh my_arch
...which will yield you a PDF with your network:

Examples are provided in the repo, below one of the them. I've tested it on OS X, should work on Linux as well. Not sure how about Windows. Naturally, you'll need a LaTeX distribution installed.

Upvotes: 6
Reputation: 2714
I adapted some parts to the answer of Milo
from matplotlib import pyplot
from math import cos, sin, atan


class Neuron():
    def __init__(self, x, y):
        self.x = x
        self.y = y

    def draw(self, neuron_radius):
        circle = pyplot.Circle((self.x, self.y), radius=neuron_radius, fill=False)
        pyplot.gca().add_patch(circle)


class Layer():
    def __init__(self, network, number_of_neurons, number_of_neurons_in_widest_layer):
        self.vertical_distance_between_layers = 6
        self.horizontal_distance_between_neurons = 2
        self.neuron_radius = 0.5
        self.number_of_neurons_in_widest_layer = number_of_neurons_in_widest_layer
        self.previous_layer = self.__get_previous_layer(network)
        self.y = self.__calculate_layer_y_position()
        self.neurons = self.__intialise_neurons(number_of_neurons)

    def __intialise_neurons(self, number_of_neurons):
        neurons = []
        x = self.__calculate_left_margin_so_layer_is_centered(number_of_neurons)
        for iteration in xrange(number_of_neurons):
            neuron = Neuron(x, self.y)
            neurons.append(neuron)
            x += self.horizontal_distance_between_neurons
        return neurons

    def __calculate_left_margin_so_layer_is_centered(self, number_of_neurons):
        return self.horizontal_distance_between_neurons * (self.number_of_neurons_in_widest_layer - number_of_neurons) / 2

    def __calculate_layer_y_position(self):
        if self.previous_layer:
            return self.previous_layer.y + self.vertical_distance_between_layers
        else:
            return 0

    def __get_previous_layer(self, network):
        if len(network.layers) > 0:
            return network.layers[-1]
        else:
            return None

    def __line_between_two_neurons(self, neuron1, neuron2):
        angle = atan((neuron2.x - neuron1.x) / float(neuron2.y - neuron1.y))
        x_adjustment = self.neuron_radius * sin(angle)
        y_adjustment = self.neuron_radius * cos(angle)
        line = pyplot.Line2D((neuron1.x - x_adjustment, neuron2.x + x_adjustment), (neuron1.y - y_adjustment, neuron2.y + y_adjustment))
        pyplot.gca().add_line(line)

    def draw(self, layerType=0):
        for neuron in self.neurons:
            neuron.draw( self.neuron_radius )
            if self.previous_layer:
                for previous_layer_neuron in self.previous_layer.neurons:
                    self.__line_between_two_neurons(neuron, previous_layer_neuron)
        # write Text
        x_text = self.number_of_neurons_in_widest_layer * self.horizontal_distance_between_neurons
        if layerType == 0:
            pyplot.text(x_text, self.y, 'Input Layer', fontsize = 12)
        elif layerType == -1:
            pyplot.text(x_text, self.y, 'Output Layer', fontsize = 12)
        else:
            pyplot.text(x_text, self.y, 'Hidden Layer '+str(layerType), fontsize = 12)

class NeuralNetwork():
    def __init__(self, number_of_neurons_in_widest_layer):
        self.number_of_neurons_in_widest_layer = number_of_neurons_in_widest_layer
        self.layers = []
        self.layertype = 0

    def add_layer(self, number_of_neurons ):
        layer = Layer(self, number_of_neurons, self.number_of_neurons_in_widest_layer)
        self.layers.append(layer)

    def draw(self):
        pyplot.figure()
        for i in range( len(self.layers) ):
            layer = self.layers[i]
            if i == len(self.layers)-1:
                i = -1
            layer.draw( i )
        pyplot.axis('scaled')
        pyplot.axis('off')
        pyplot.title( 'Neural Network architecture', fontsize=15 )
        pyplot.show()

class DrawNN():
    def __init__( self, neural_network ):
        self.neural_network = neural_network

    def draw( self ):
        widest_layer = max( self.neural_network )
        network = NeuralNetwork( widest_layer )
        for l in self.neural_network:
            network.add_layer(l)
        network.draw()
Now the layers are also labeled, the axis are deleted and constructing the plot is easier. It's simply done by:
network = DrawNN( [2,8,8,1] )
network.draw()
Here a net with the following structure is constructed:
- 2 Neurons in the input layer
- 8 Neurons in the 1st hidden layer
- 8 Neurons in the 2nd hidden layer
- 1 Neuron in the output layer

Upvotes: 36

Reputation: 733
Here is a library based on matplotlib, named viznet (pip install viznet). To begin, you can read this notebook. Here is an example

Viznet defines a set of brush rules.
node1 >> (0, 1.2)  # put a node centered at axis (0, 1.2)
node2 >> (2, 0)    # put a node centered at axis (2, 0)
edge >> (node1, node2)  # connect two nodes
Here, node1 and node2 are two node brushes, like
node1 = NodeBrush('nn.input', ax=d.ax, size='normal')
The first parameter defines the theme of node. For a neural network node (theme start with 'nn.'), its style refers from Neural Network Zoo Page。

For edges, we can define its brush like edge = EdgeBrush('->', ax=d.ax, lw=2)
The first parameters is the theme,'-' for straight line, '.' for dashed line, '=' for double line, '>','<' are left arrow and right arrow. The proportion of '-', '.' and '=' in a theme code decides their length in a line. For example, '->' and '->-' represents lines with arrow at end and arrow at center respectively. The following are several examples

With only nodes and edges are not enough, the rule for connection plays a fundamentally role. Except basic connection rule, you can create pins on nodes. I will stop here and leave it for documents. These flexible features make it capable for drawing also tensor networks and quantum circuits.
This project just embraced its v0.1 release, I will keep improving it. You can access its Github repo for latest version, and wellcome for pulling requests or posting issues!
Upvotes: 9

Reputation: 742
To implement what Mykhaylo has suggested, I've slightly modified the Milo's code in order to allow providing weghts as an argument which will affect every line's width. This argument is optional, as there's no sense of providing weights for the last layer. All this to be able to visualize my solution to this exercise on neural networks. I've given binary weights (either 0 or 1), so that lines with zero weight not be drawn at all (to make an image more clear).
from matplotlib import pyplot
from math import cos, sin, atan
import numpy as np


class Neuron():
    def __init__(self, x, y):
        self.x = x
        self.y = y

    def draw(self):
        circle = pyplot.Circle((self.x, self.y), radius=neuron_radius, fill=False)
        pyplot.gca().add_patch(circle)


class Layer():
    def __init__(self, network, number_of_neurons, weights):
        self.previous_layer = self.__get_previous_layer(network)
        self.y = self.__calculate_layer_y_position()
        self.neurons = self.__intialise_neurons(number_of_neurons)
        self.weights = weights

    def __intialise_neurons(self, number_of_neurons):
        neurons = []
        x = self.__calculate_left_margin_so_layer_is_centered(number_of_neurons)
        for iteration in range(number_of_neurons):
            neuron = Neuron(x, self.y)
            neurons.append(neuron)
            x += horizontal_distance_between_neurons
        return neurons

    def __calculate_left_margin_so_layer_is_centered(self, number_of_neurons):
        return horizontal_distance_between_neurons * (number_of_neurons_in_widest_layer - number_of_neurons) / 2

    def __calculate_layer_y_position(self):
        if self.previous_layer:
            return self.previous_layer.y + vertical_distance_between_layers
        else:
            return 0

    def __get_previous_layer(self, network):
        if len(network.layers) > 0:
            return network.layers[-1]
        else:
            return None

    def __line_between_two_neurons(self, neuron1, neuron2, linewidth):
        angle = atan((neuron2.x - neuron1.x) / float(neuron2.y - neuron1.y))
        x_adjustment = neuron_radius * sin(angle)
        y_adjustment = neuron_radius * cos(angle)
        line_x_data = (neuron1.x - x_adjustment, neuron2.x + x_adjustment)
        line_y_data = (neuron1.y - y_adjustment, neuron2.y + y_adjustment)
        line = pyplot.Line2D(line_x_data, line_y_data, linewidth=linewidth)
        pyplot.gca().add_line(line)

    def draw(self):
        for this_layer_neuron_index in range(len(self.neurons)):
            neuron = self.neurons[this_layer_neuron_index]
            neuron.draw()
            if self.previous_layer:
                for previous_layer_neuron_index in range(len(self.previous_layer.neurons)):
                    previous_layer_neuron = self.previous_layer.neurons[previous_layer_neuron_index]
                    weight = self.previous_layer.weights[this_layer_neuron_index, previous_layer_neuron_index]
                    self.__line_between_two_neurons(neuron, previous_layer_neuron, weight)


class NeuralNetwork():
    def __init__(self):
        self.layers = []

    def add_layer(self, number_of_neurons, weights=None):
        layer = Layer(self, number_of_neurons, weights)
        self.layers.append(layer)

    def draw(self):
        for layer in self.layers:
            layer.draw()
        pyplot.axis('scaled')
        pyplot.show()


if __name__ == "__main__":
    vertical_distance_between_layers = 6
    horizontal_distance_between_neurons = 2
    neuron_radius = 0.5
    number_of_neurons_in_widest_layer = 4
    network = NeuralNetwork()
    # weights to convert from 10 outputs to 4 (decimal digits to their binary representation)
    weights1 = np.array([\
                         [0,0,0,0,0,0,0,0,1,1],\
                         [0,0,0,0,1,1,1,1,0,0],\
                         [0,0,1,1,0,0,1,1,0,0],\
                         [0,1,0,1,0,1,0,1,0,1]])
    network.add_layer(10, weights1)
    network.add_layer(4)
    network.draw()
Upvotes: 9

Reputation: 1107
The Python library matplotlib provides methods to draw circles and lines. It also allows for animation.
I've written some sample code to indicate how this could be done. My code generates a simple static diagram of a neural network, where each neuron is connected to every neuron in the previous layer. Further work would be required to animate it.
I've also made it available in a Git repository.

from matplotlib import pyplot
from math import cos, sin, atan


class Neuron():
    def __init__(self, x, y):
        self.x = x
        self.y = y

    def draw(self):
        circle = pyplot.Circle((self.x, self.y), radius=neuron_radius, fill=False)
        pyplot.gca().add_patch(circle)


class Layer():
    def __init__(self, network, number_of_neurons):
        self.previous_layer = self.__get_previous_layer(network)
        self.y = self.__calculate_layer_y_position()
        self.neurons = self.__intialise_neurons(number_of_neurons)

    def __intialise_neurons(self, number_of_neurons):
        neurons = []
        x = self.__calculate_left_margin_so_layer_is_centered(number_of_neurons)
        for iteration in xrange(number_of_neurons):
            neuron = Neuron(x, self.y)
            neurons.append(neuron)
            x += horizontal_distance_between_neurons
        return neurons

    def __calculate_left_margin_so_layer_is_centered(self, number_of_neurons):
        return horizontal_distance_between_neurons * (number_of_neurons_in_widest_layer - number_of_neurons) / 2

    def __calculate_layer_y_position(self):
        if self.previous_layer:
            return self.previous_layer.y + vertical_distance_between_layers
        else:
            return 0

    def __get_previous_layer(self, network):
        if len(network.layers) > 0:
            return network.layers[-1]
        else:
            return None

    def __line_between_two_neurons(self, neuron1, neuron2):
        angle = atan((neuron2.x - neuron1.x) / float(neuron2.y - neuron1.y))
        x_adjustment = neuron_radius * sin(angle)
        y_adjustment = neuron_radius * cos(angle)
        line = pyplot.Line2D((neuron1.x - x_adjustment, neuron2.x + x_adjustment), (neuron1.y - y_adjustment, neuron2.y + y_adjustment))
        pyplot.gca().add_line(line)

    def draw(self):
        for neuron in self.neurons:
            neuron.draw()
            if self.previous_layer:
                for previous_layer_neuron in self.previous_layer.neurons:
                    self.__line_between_two_neurons(neuron, previous_layer_neuron)


class NeuralNetwork():
    def __init__(self):
        self.layers = []

    def add_layer(self, number_of_neurons):
        layer = Layer(self, number_of_neurons)
        self.layers.append(layer)

    def draw(self):
        for layer in self.layers:
            layer.draw()
        pyplot.axis('scaled')
        pyplot.show()

if __name__ == "__main__":
    vertical_distance_between_layers = 6
    horizontal_distance_between_neurons = 2
    neuron_radius = 0.5
    number_of_neurons_in_widest_layer = 4
    network = NeuralNetwork()
    network.add_layer(3)
    network.add_layer(4)
    network.add_layer(1)
    network.draw()
Upvotes: 14

Reputation: 953
Draw the network with nodes as circles connected with lines. The line widths must be proportional to the weights. Very small weights can be displayed even without a line.
Upvotes: 1
Related Questions
- How to visualize a keras neural network with trained weights?
- Drawing a neural network
- Visualizing CNN
- Neural Network basic understanding and visualisation
- how to plot byprain neural network structure
- visualization of convolutional layer in keras model
- visualization of a neural network model using keras 1.2
- Create image of Neural Network structure
- How can a neural network architecture be visualized with Keras?
- Neural network receptive field visualization in python