
Reputation: 2358
Bitbucket activity graph
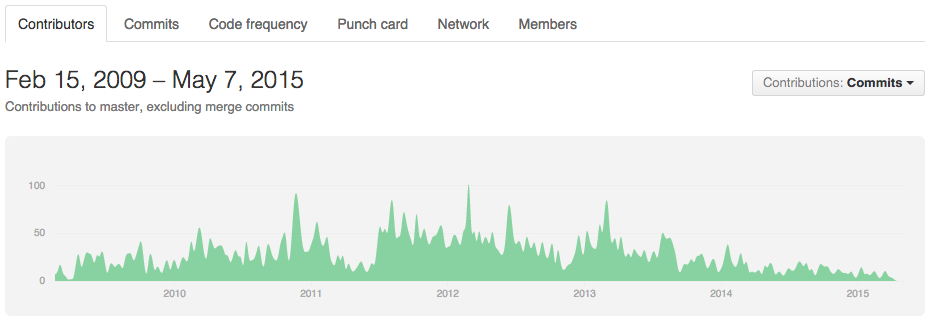
I would like to know if there is a solution in Bitbucket similar to Github's graphs. For example, here are the ones for Node.js:
Contributions graph
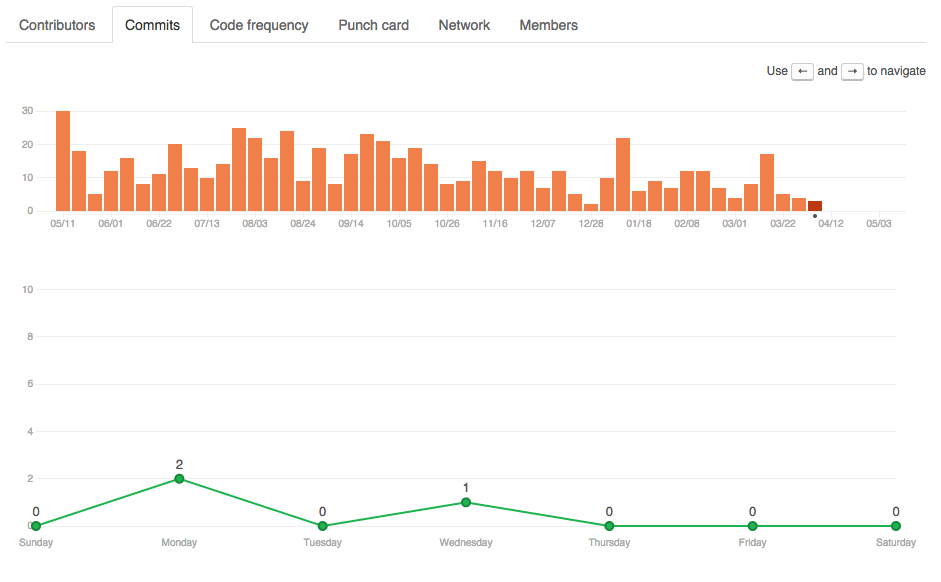
Commits graph
I've done some research and I haven't found anything similar. Does anybody know if this kind of visualisation exists in a hidden place in Bitbucket? Or is there some 3rd party service which provides these kinds of graphs of a git repository?
Upvotes: 78
Views: 83581
Answers (3)

Reputation: 921
Take a look at Awesome Graphs for Bitbucket add-on
If you are currently a user of Bitbucket and want to take a sneak peak, click on your avatar, select “Manage Account”, and simply install these new add-ons by selecting “Find new add-ons” from the left menu.
Here is the add-on's release notes page: https://docs.stiltsoft.com/awesome-graphs/cloud/release-notes-cloud
Upvotes: 61

Reputation: 1629
I used gitstats and it was amazing. Just what I was looking for.
http://gitstats.sourceforge.net/
I just cloned the repo, installed gnuplot with homebrew on OSX, and voila. I had full nice stats in a few seconds. No need to have admin permissions to install in bitbucket. No use of the cloud and giving others view of my stats. It produces a TON of nice charts. Not probably as pretty as true professional ones, but did the job for sure.
Here's a quick example of a rewrite of our apps to Flutter:

Upvotes: 3

Reputation: 13731
Click on account at top-right corner -> integrations -> Awesome Graphs -> add
Upvotes: 11
Related Questions
- Bitbucket user activity log
- How to interpret Bitbucket Commit Graph's visualization?
- How do I visualise my git repo properly?
- Bitbucket recent activities - Repo activity is currently unavailable
- how to use Bitbucket
- Bitbucket Repository
- Report of bitbucket and github pull and push
- Does BitBucket / GitLab has graph of Contributions or Activity, just like GitHub?
- Looking for a BitBucket Workflow
- Bitbucket obtain information about all commits of a repository