
Reputation: 1547
Categorical axis order in plotly.js
I have a plotly.js bar chart that I am trying to get the order of the categorical axis right. Each category has a single bar, but sometimes they are green and sometimes they are yellow. The bars should be in order from highest to lowest, but plotly seems to order them based on the different fills.
The data:
var data = [
  {
    "marker": {
        "color": "#006666"
    },
    "x": ["A:0122", "A:0121", "A:0434", "A:0838", "A:0083", "A:0081", "A:0687"],
    "y": [1246.0, 1096.0, 1000.0, 200.0, 0.0, 0.0, 0.0],
    "name": "Green",
    "type": "bar"
  },
  {
    "marker": {
        "color": "#C87B31"
    },
    "x": ["A:0169", "A:0175"],
    "y": [270.0, 0.0],
    "name": "Yellow",
    "type": "bar"
  }
];
The layout:
var layout = {
    "margin": {
        "t": 0
    },
    "barmode": "stack",
    "tickangle": -90,
    "showlegend": true,
    "xaxis": {
        "title": "Idea",
        "tickmode": "array",
        "tickvals": ["A:0122", "A:0121", "A:0434", "A:0169", "A:0838", "A:0083", "A:0175", "A:0081", "A:0687"]
    },
    "yaxis": {
        "title": "Result"
    }
};
Other configuation:
{"showLink":false, "displaylogo":false}
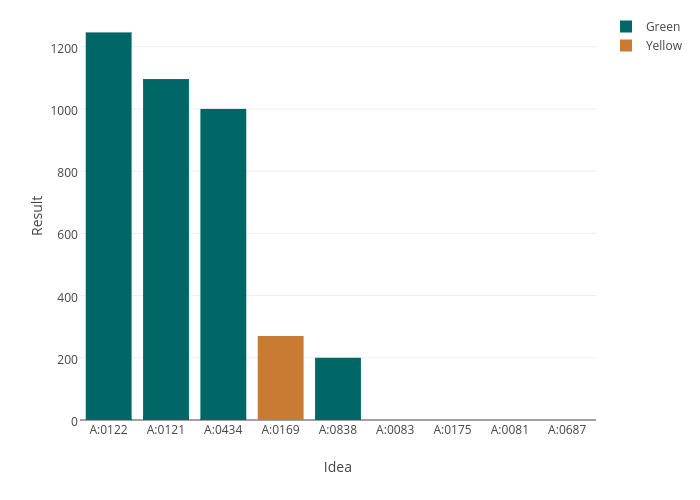
But here is the result:

Notice that "A:0169" should be the fourth bar, but instead it is the last.
How do I get the bars to be in the order I specify in tickvals? Or can I specify their order in a different way?
Upvotes: 9
Views: 8818
Answers (2)

Reputation: 6065
Since Plotly.js 1.10.2, you can use categoryorder and categoryarray to control the order of a categorical axis. This way you can keep x as a list of strings.
Usage:
var data = [
  {
    "x": ["A", "D", "B"],
    "y": [1, 2, 3],
    "type": "bar"
  },
  {
    "x": ["C", "E"],
    "y": [2, 3],
    "type": "bar"
}];

var layout = {
    "xaxis": {
        "categoryorder": "array",
        "categoryarray":  ["A", "B", "C", "D", "E"]
    }
};
For your exact example:
var data = [{
    "marker": {
        "color": "#006666"
    },
    "x": ["A:0122", "A:0121", "A:0434", "A:0838", "A:0083", "A:0081", "A:0687"],
    "y": [1246.0, 1096.0, 1000.0, 200.0, 0.0, 0.0, 0.0],
    "name": "Green",
    "type": "bar"
}, {
    "marker": {
        "color": "#C87B31"
    },
    "x": ["A:0169", "A:0175"],
    "y": [270.0, 0.0],
    "name": "Yellow",
    "type": "bar"
}];

var layout = {
    "margin": {
        "t": 0
    },
    "barmode": "stack",
    "tickangle": -90,
    "showlegend": true,
    "xaxis": {
        "title": "Idea",
        "categoryorder": "array",
        "categoryarray":  ["A:0122", "A:0121", "A:0434", "A:0169", "A:0838", "A:0083", "A:0175", "A:0081", "A:0687"]
    },
    "yaxis": {
        "title": "Result"
    }
};
Result:

Upvotes: 7

Reputation: 236
You can set x and tickvals to an ordered array then add the xaxis labels with ticktext i.e.
data:
    [{
    "marker": {"color": "#006666"},
    "x": [0, 1, 2, 4, 5, 7, 8],
    "y": [1246.0, 1096.0, 1000.0, 200.0, 0.0, 0.0, 0.0],
    "name": "Green",
    "type": "bar"
    }, {
    "marker": {"color": "#C87B31"},
    "x": [3, 6],
    "y": [270.0, 0.0],
    "name": "Yellow",
    "type": "bar"
    }],
layout:
    {
    "margin": {"t": 0},
    "barmode": "stack",
    "tickangle": -90,
    "showlegend": true,
    "xaxis": {
      "title": "Idea",
      "tickmode": "array",
      "tickvals": [0, 1, 2, 3, 4, 5, 6, 7, 8],
      "ticktext": ["A:0122", "A:0121", "A:0434", "A:0169", "A:0838", "A:0083",
                   "A:0175", "A:0081", "A:0687"]
    },
    "yaxis": {
      "title": "Result"
    }}
alternatively, if you're only concerned about the color of the bars you can plot one trace and set color as an array:
    var data = [{
      "x": ["A:0122", "A:0121", "A:0434", "A:0169", "A:0838", "A:0083",
            "A:0175", "A:0081", "A:0687"],
      "y": [1246.0, 1096.0, 1000.0, 270.0, 200.0, 0.0, 0.0, 0.0, 0.0],
      "type": "bar",
      "marker": {"color": ["#006666", "#006666", "#006666", "#C87B31",
                  "#006666", "#006666", "#C87B31", "#006666"]}
    }],
    layout = {
      "margin": {"t": 0},
      "xaxis": {"title": "Idea"},
      "yaxis": {"title": "Result"}
    };
Upvotes: 9
Related Questions
- Y Axis Values Out of Order
- How to custom order the x axis category orders in plotly express subplots
- Plotly (Python) - Can plotly inherit categories order setted in pandas?
- Ordering x-axis with plotly in R
- Plotly Express: Order of elements in plot (python)
- Ordering in r plotly barchart
- Javascript - Plotly.js number frequency in order
- Categories order in vertical bar chart ( in Plotly )
- How to force plotly to display x axis numbers as categories?
- arrange X axis in descending order using plotly