
nonopolarity
Reputation: 150976
Javascript profiler shows each() spending a lot of time, but how to find where it is?
IE 8 and Firebug's Javascript profiler both showed that jQuery each() spent a lot of time, but since the each() is not inside a function, there is no way to tell which line it is, and there are lots of these each() in the global scope of the source code. On Firebug, it can show you the file and line number, but it will take you to jQuery source code of each() without any call stack, so it is no use.
Is there a way to find out which each() it was?
Upvotes: 0
Views: 206
Answers (1)

Vincent McNabb
Reputation: 34659
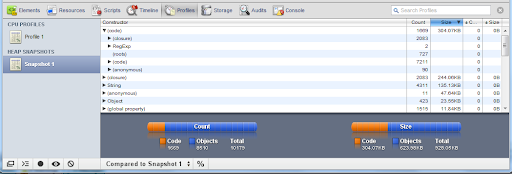
Google Chrome's Javascript console lets you take a snapshot of the stack under the "Profiling" tab.
The Scripts tab allows you to step through your scripts line by line.
Upvotes: 1
Related Questions
- JavaScript Code Works Faster when JS Profiling is on? What?
- How to identify what is happening during "Other" in chrome profiling tool
- JavaScript profiling with per-statement results
- Understanding Firebug profiler output
- How to tell where a Javascript is taking the most time?
- Javascript profiler
- firebug - how can I detect what functions have been called or from where a function has been called
- How do I find/profile what JavaScript is being executed "right now" using Firebug or any other way?
- profiler for slow javascript (jquery) on page event? "Unresponsive Script" error
- how to find which part of js is slowing the page down