
Reputation: 1221
How to plot aggregate results after groupby in Pandas?
I've recently started learning Pandas and I'm having some trouble on how to plot results after using groupby and agg. Using Pandas, I have created a data frame and grouped it based on two columns 'ID' and 'x'. Then I selected one specific column ('results') from the group to calculate the sem and mean.
Specifically, the code:
df = pd.read_csv('pandas_2015-11-7.csv')
df_group = df.groupby(['x','ID'])['results']
df_group_results = df_group.agg([stats.sem, np.mean])
The results look like the following:
            sem      mean
x    ID
2.5  0     0.010606  0.226674
     1     0.000369  0.490820
     2     0.000508  0.494094
5.0  0     0.001672  0.005059
     1     0.012252  0.190962
     2     0.003696  0.170342
7.5  0     0.001630  0.004506
     1     0.002567  0.016109
     2     0.002081  0.047301
10.0 0     0.000000  0.000000
     1     0.000000  0.000000
     2     0.000000  0.000000
12.5 0     0.000000  0.000000
     1     0.000000  0.000000
     2     0.000000  0.000000
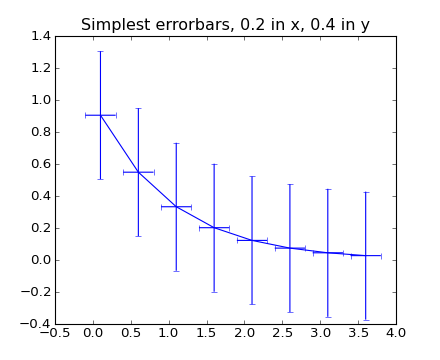
My question is how do I make a line plot with error bars based on these results? The x-axis should be based on the 'x' value and 'ID' determines the lines (in this case 3 lines with legends of 0, 1, and 2). The desired plot that I want to achieve is like this 
(source: matplotlib.org)
.
Upvotes: 2
Views: 3875
Answers (1)

Reputation: 706
The groupby() method returns a hierarchical index (multi-index):
http://pandas.pydata.org/pandas-docs/stable/advanced.html
If I create a df with a similar hierarchical index:
import pandas as pd
df = pd.DataFrame({'mean':[0.5,0.25,0.7,0.8],'sem':[0.1,0.1,0.1,0.2]})
df.index = pd.MultiIndex(levels=[[2.5,5.0],[0,1]],labels=[[0,0,1,1],[0,1,0,1]],names=['x','ID'])
Then I have the following df:
        mean  sem
x   ID
2.5 0   0.50  0.1
    1   0.25  0.1
5.0 0   0.70  0.1
    1   0.80  0.2
I can grab the relevant information from the multi-index, and use it to select and plot the correct rows in sequence:
x_values = df.index.levels[0]
ID_values = df.index.levels[1]

for ID in ID_values:
    mean_data = df.loc[[(x,ID) for x in x_values],'mean'].tolist()
    error_data = df.loc[[(x,ID) for x in x_values],'sem'].tolist()
    matplotlib.pyplot.errorbar(x_values,mean_data,yerr=error_data)

legend(ID_values)
Upvotes: 2
Related Questions
- GroupBy and plot with pandas
- Groupby and plot
- Plot the result of a groupby operation in pandas
- How to Groupby and plot it
- Plot Pandas groupby dataframe
- Plotting result of groupBy in pandas
- How to plot data after groupby
- Plot data returned from groupby function in Pandas using Matplotlib
- Plotting pandas groupby
- Plotting with GroupBy in Pandas/Python