
Ahmad Sultan
Reputation: 1751
Managing the palette indicators in gnuplot
I would like to ask if someone knows how to manage the palette indicators in gnuplot, I want it to fit with my colors(12) and not to be added automatically
my code is
 set palette model HSV
 set palette rgb 3,2,2
 set palette maxcolors 12
 set view map
 set size square
 set key off
 set title "Neural network output (fitted curve)"
 set xlabel "x"
 set ylabel "y"
 set zlabel "z"
 set xrange [  -7.6625930750000002  :   27.166801390000000      ]
 set yrange [  0.35422432799999998  :   30.163194489999999      ]
 set zrange [  -55.934824620000001  :   2.4059901000000002E-002 ]
 set grid
 set terminal png size 1200,900
 set output "output/fitted_curve.png "
 splot "output/plot_data_pl.txt " with points palette pt 7 ps 1

Upvotes: 3
Views: 2833
Answers (1)

F. Knorr
Reputation: 3065
For the maximum flexibility, you should define your own palette.
Here is what I once did to obtain a plot with 7 distinct colors. Thereby, I can also define which color represents a given range of values.
set palette defined (0 "black",\
                     0.5 "black",\
                     0.5 "red",\
                     1.5 "red",\
                     1.5 "orange-red",\
                     2.5 "orange-red",\
                     2.5 "orange",\
                     3.5 "orange",\
                     3.5 "yellow",\
                     4.5 "yellow",\
                     4.5 "light-green",\
                     5.5 "light-green",\
                     5.5 "green",\
                     6.5 "green")

Hence, you actually have to define from / to which value you want a color to span.
Of course, you can use rgb definitions for your color. A list of gnuplot-defined colors is here.
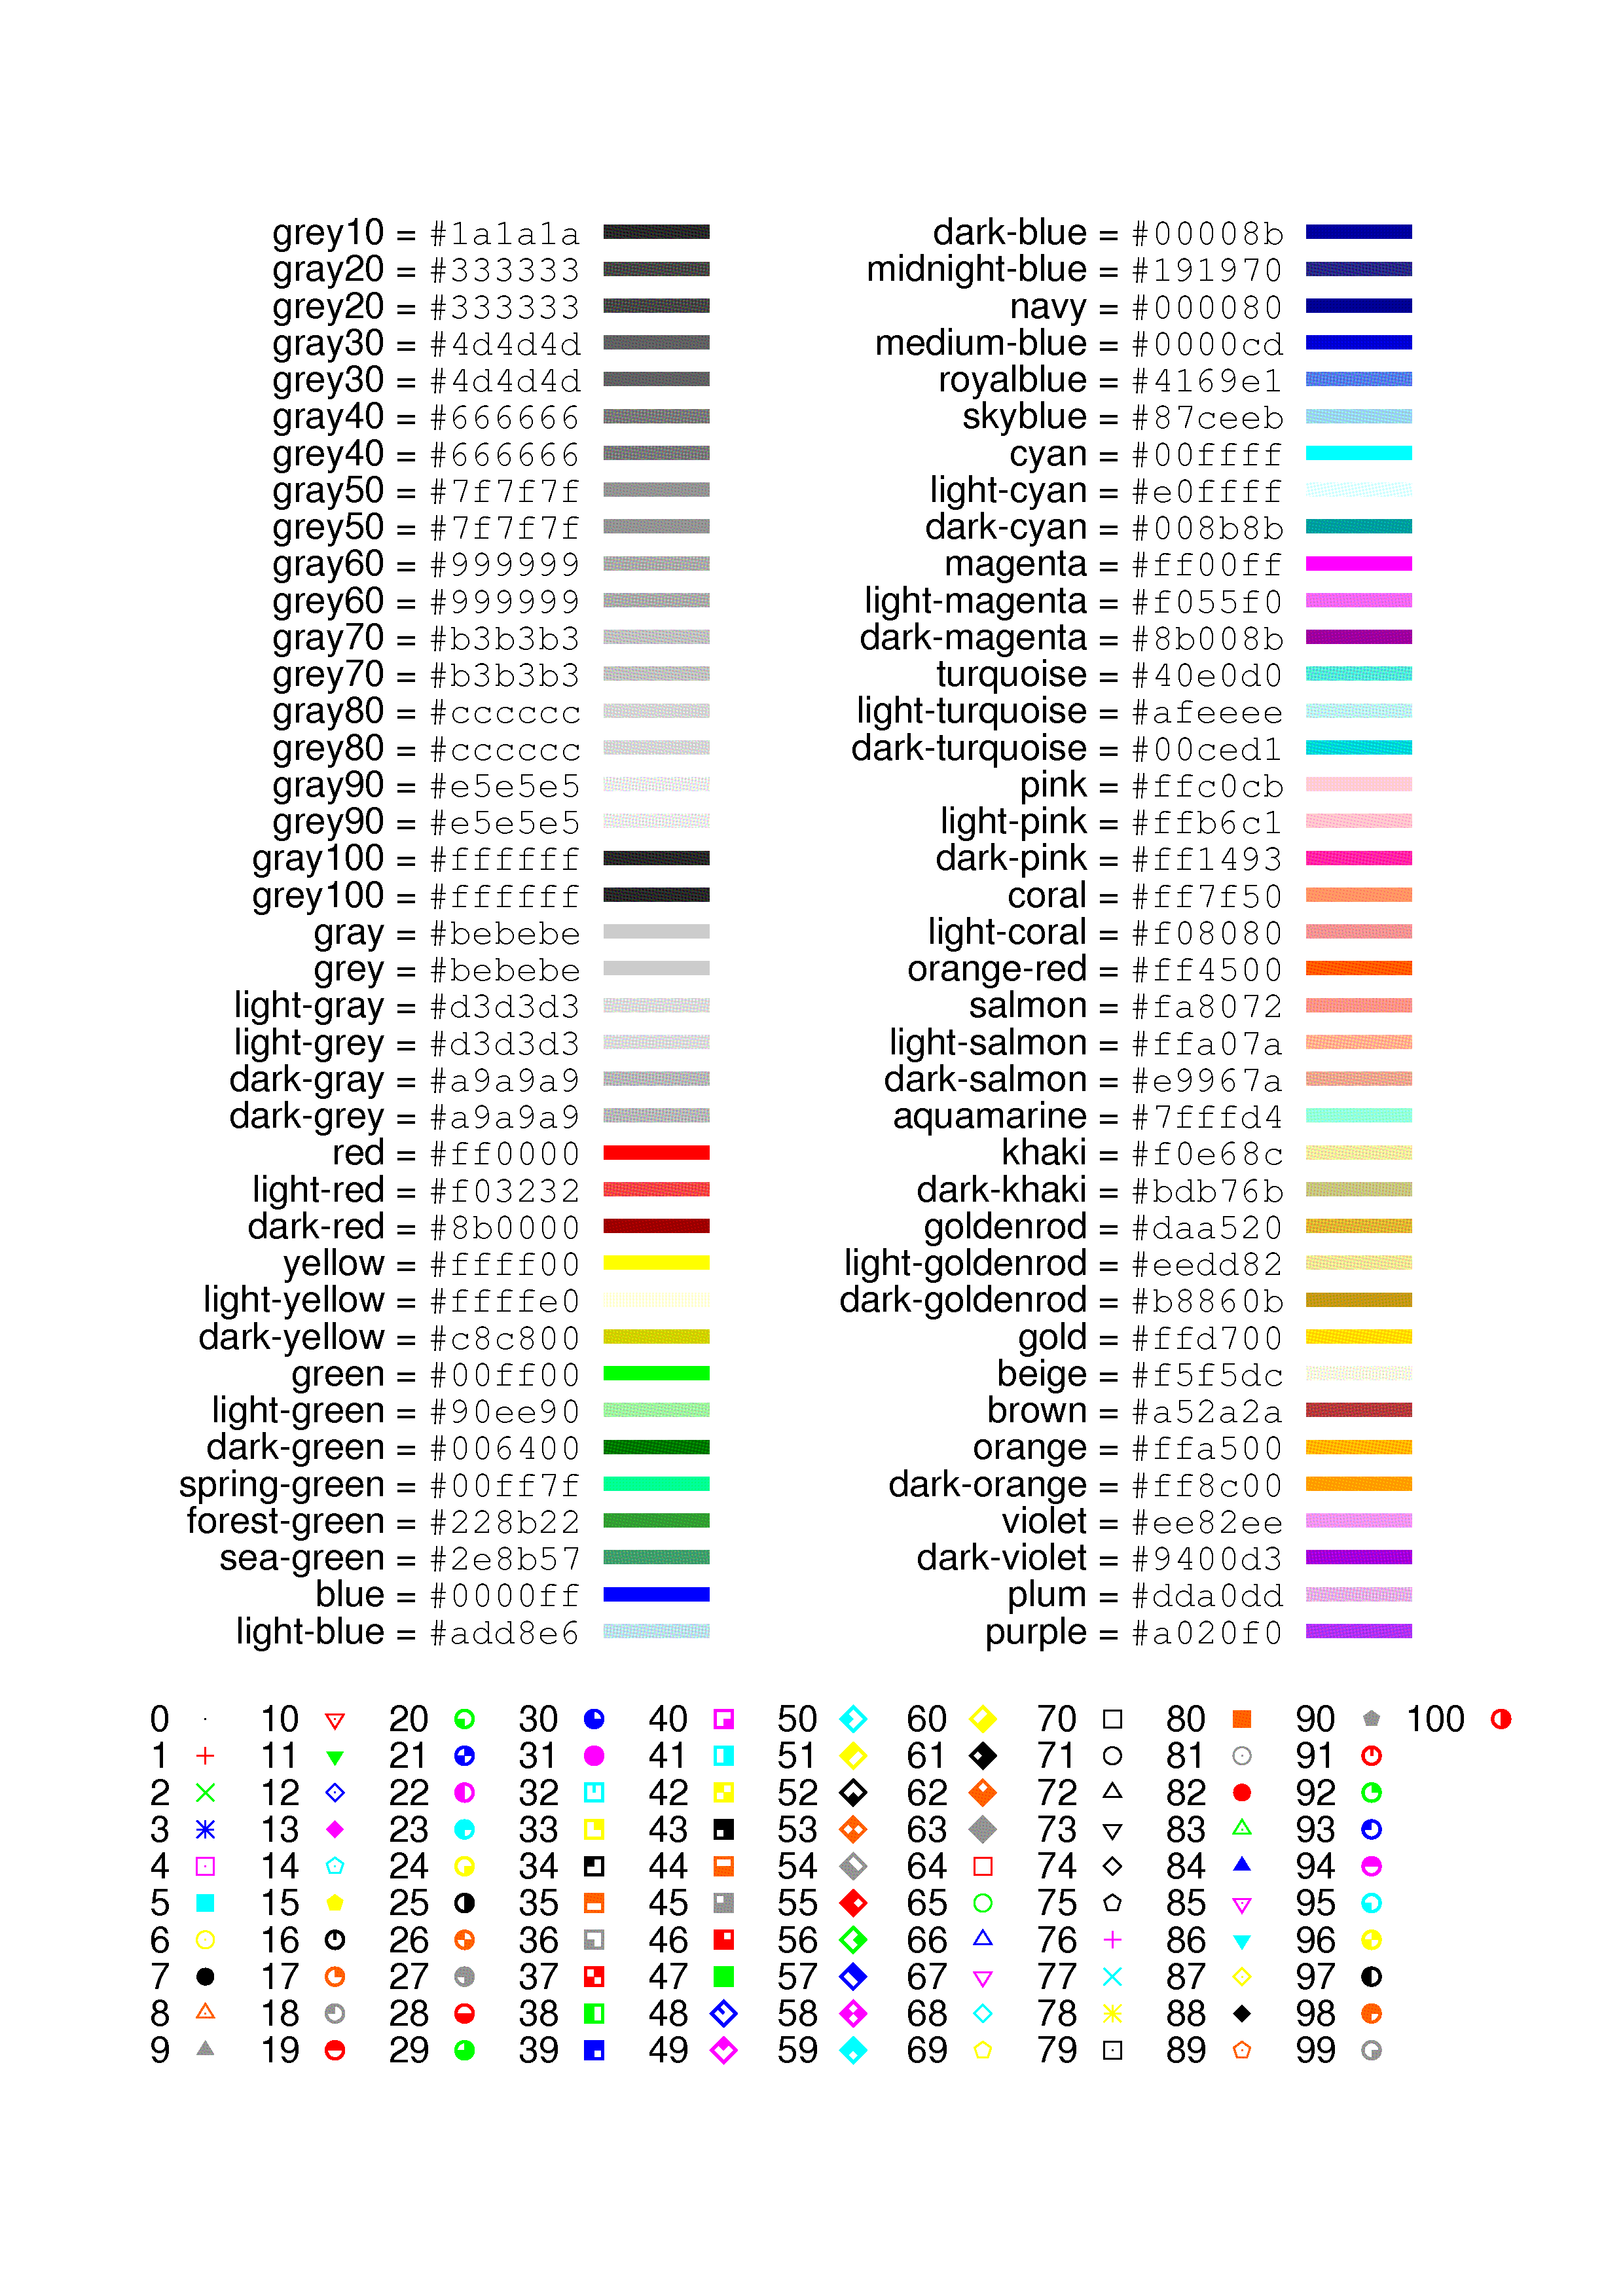
For the sake of completeness, here is the entire code I used:
set view map
set pm3d

set term pngcairo crop font 'lmroman10,32' size 1152,864
set border lw 2
set palette defined (0 "black", 0.5 "black", 0.5001 "red", 1.5 "red", 1.5001 "orange-red", 2.5 "orange-red", 2.5001 "orange", 3.5 "orange", 3.5001 "yellow", 4.5 "yellow", 4.5001 "light-green", 5.5 "light-green", 5.5001 "green", 6.5 "green")
set xlab 'time step ' offset 0,1
set xtics 2500 offset 0,0.65
set ylab 'position [cell]' offset +.5,0
set cblab 'velocity [cells/(time step)]' offset -.8,0
set cbtics offset -1.2,0
set xrange[100000:110000]
set yrange[0:10000]
set cbrange[0:6.5]

set style line 1 lt 1 lc rgb "blue" lw .85 pt 6 ps .6

splot '6.csv' u (($1)):($2):($3) w p palette t '', 'data.csv' u (($1)):($2):($3*0) w l ls 1 t '',  'data2.csv' u (($1)):($2):($3*0) w l ls 1 t ''
Upvotes: 2
Related Questions
- Red color palette for gnuplot
- Gnuplot: loading palette?
- Gnuplot: How to assign specific colors to values out of palette range?
- value dependent color plot in gnuplot
- gnuplot: plotting single palette in multiplot mode
- plotting gnuplot with palette showing some labels
- gnuplot palette, default and defined
- gnuplot text color palette
- Change colors in Gnuplot like the ones from the gallery
- Gnuplot: controlling colours and ranges of "set palette."