
Reputation: 21
How to encode an image in frequency spectrum at python?
I have a problem with encoding an image into a spectrum of some .wav file, so that the outcome look similar to this: http://www.bastwood.com/projects/aphex_face/aphex.png
I am just getting started with programming, so I'm searching for quite easy to understand solution.
Someone can help?
Upvotes: 1
Views: 5757
Answers (1)

Reputation: 11473
In order to encode an image into spectrum of wave , you may use below program downloaded from GitHub. Spectrogram python code converts image into an audio wave file.
#!/usr/bin/python
import numpy as np
import matplotlib.image as mpimg
import wave
from array import array


def make_wav(image_filename):
    """ Make a WAV file having a spectrogram resembling an image """
    # Load image
    image = mpimg.imread(image_filename)
    image = np.sum(image, axis = 2).T[:, ::-1]
    image = image**3 # ???
    w, h = image.shape

    # Fourier transform, normalize, remove DC bias
    data = np.fft.irfft(image, h*2, axis=1).reshape((w*h*2))
    data -= np.average(data)
    data *= (2**15-1.)/np.amax(data)
    data = array("h", np.int_(data)).tostring()

    # Write to disk
    output_file = wave.open(image_filename+".wav", "w")
    output_file.setparams((1, 2, 44100, 0, "NONE", "not compressed"))
    output_file.writeframes(data)
    output_file.close()
    print "Wrote %s.wav" % image_filename


if __name__ == "__main__":

    my_image = "spectrogram.png"
    make_wav(my_image)
In order to display the wave file as a spectrogram, you have couple of choices. Depending on your platform, you can download sox and run
sox <yourImage>.jpg.wav -n spectrogram
SOX , short for sound exchange will then convert the audio wave file of image into an image Spectrogram.

Or If you don't want to download SOX, you can use following program to create a Spectrogram of image audio wave file.
#!/usr/bin/env python
#coding: utf-8
""" This work is licensed under a Creative Commons Attribution 3.0 Unported License.
Frank Zalkow, 2012-2013 """
import numpy as np
from matplotlib import pyplot as plt
import scipy.io.wavfile as wav
from numpy.lib import stride_tricks
""" short time fourier transform of audio signal """
def stft(sig, frameSize, overlapFac=0.5, window=np.hanning):
win = window(frameSize)
hopSize = int(frameSize - np.floor(overlapFac * frameSize))
# zeros at beginning (thus center of 1st window should be for sample nr. 0)
samples = np.append(np.zeros(np.floor(frameSize/2.0)), sig)
# cols for windowing
cols = np.ceil( (len(samples) - frameSize) / float(hopSize)) + 1
# zeros at end (thus samples can be fully covered by frames)
samples = np.append(samples, np.zeros(frameSize))
frames = stride_tricks.as_strided(samples, shape=(cols, frameSize), strides=(samples.strides[0]*hopSize, samples.strides[0])).copy()
frames *= win
return np.fft.rfft(frames)
""" scale frequency axis logarithmically """
def logscale_spec(spec, sr=44100, factor=20.):
timebins, freqbins = np.shape(spec)
scale = np.linspace(0, 1, freqbins) ** factor
scale *= (freqbins-1)/max(scale)
scale = np.unique(np.round(scale))
# create spectrogram with new freq bins
newspec = np.complex128(np.zeros([timebins, len(scale)]))
for i in range(0, len(scale)):
if i == len(scale)-1:
newspec[:,i] = np.sum(spec[:,scale[i]:], axis=1)
else:
newspec[:,i] = np.sum(spec[:,scale[i]:scale[i+1]], axis=1)
# list center freq of bins
allfreqs = np.abs(np.fft.fftfreq(freqbins*2, 1./sr)[:freqbins+1])
freqs = []
for i in range(0, len(scale)):
if i == len(scale)-1:
freqs += [np.mean(allfreqs[scale[i]:])]
else:
freqs += [np.mean(allfreqs[scale[i]:scale[i+1]])]
return newspec, freqs
""" plot spectrogram"""
def plotstft(audiopath, binsize=2**10, plotpath=None, colormap="jet"):
samplerate, samples = wav.read(audiopath)
s = stft(samples, binsize)
sshow, freq = logscale_spec(s, factor=1.0, sr=samplerate)
ims = 20.*np.log10(np.abs(sshow)/10e-6) # amplitude to decibel
timebins, freqbins = np.shape(ims)
plt.figure(figsize=(15, 7.5))
plt.imshow(np.transpose(ims), origin="lower", aspect="auto", cmap=colormap, interpolation="none")
plt.colorbar()
plt.xlabel("time (s)")
plt.ylabel("frequency (hz)")
plt.xlim([0, timebins-1])
plt.ylim([0, freqbins])
xlocs = np.float32(np.linspace(0, timebins-1, 5))
plt.xticks(xlocs, ["%.02f" % l for l in ((xlocs*len(samples)/timebins)+(0.5*binsize))/samplerate])
ylocs = np.int16(np.round(np.linspace(0, freqbins-1, 10)))
plt.yticks(ylocs, ["%.02f" % freq[i] for i in ylocs])
if plotpath:
plt.savefig(plotpath, bbox_inches="tight")
else:
plt.show()
plt.clf()
plotstft("spectrogram.png.wav")
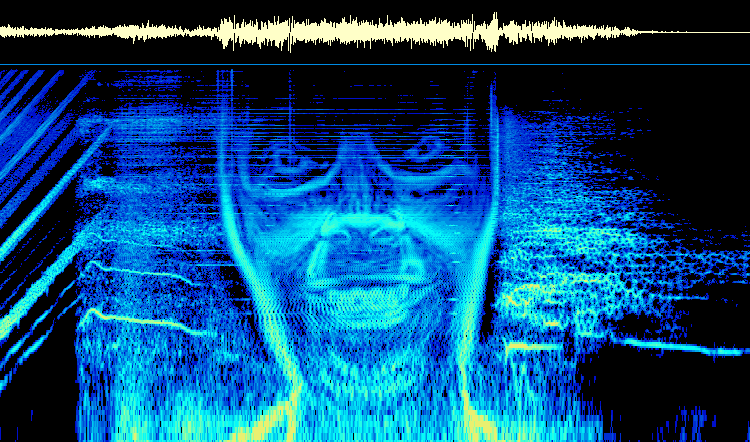
#
Image Spectrogram is as below:

Upvotes: 3
Related Questions
- Does Python have a ternary conditional operator?
- What does the "yield" keyword do in Python?
- What is the difference between @staticmethod and @classmethod in Python?
- How slicing in Python works
- How do I check whether a file exists without exceptions?
- How do I merge two dictionaries in a single expression in Python?
- What are metaclasses in Python?
- How do I get the current time in Python?
- How can I access environment variables in Python?
- How do I execute a program or call a system command?