Reputation: 8324
Heatmap Tools For Web Apps
I have a client that want to have a web app I'm building for them display heat maps of the data.
I haven't worked with heat maps at all and I was wondering if anyone knew of some good tools for generating them.
Thanks.
Upvotes: 7
Views: 6536
Answers (7)
Reputation: 11
I have a compelling heatmaps tool for both PC and mobile web pages to recommend: http://miapex.com
Upvotes: 1
Reputation: 51186
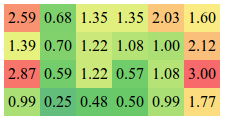
Might I suggest my own jQuery plugin?
jQuery Hottie makes it easy to take normal markup and add a background color like so:

<!-- Coloring elements is easy! -->
<ul id="example1">
  <li>1<li>
  <li>2<li>
  <li>3<li>
  <li>4<li>
  <li>5<li>
</ul>

$('ul#example1 li').hottie();
Upvotes: 0
Reputation: 61
If you want to generate heatmaps on the clientside (with JavaScript) I can recommend heatmap.js to you. It uses the HTML5 Canvas element to generate dynamic web heatmaps, you can new add data at any time and the heatmaps refresh.
Upvotes: 2
Reputation: 4155
Pyheat is another good library in python for building heatmaps. Gheat is already mentioned in a reply by J.J.
Upvotes: 1
Reputation: 5069
I realize this is an old, old post -- but the next guy to stumble across this page might try gheat for heatmaps in webapps. There are ports for Django and Google App Engine, if you happen to be using those backends.
Upvotes: 5
Reputation: 109
Heat maps are often used in place of a more conventional term: kernel density estimators. If you need to compute these on the fly, consider GRASS GIS- specifically, the v.kernel or v.neighbors modules. These will generate a continuous estimate (i.e. raster surface) of density, at some target resolution (defined by the current region settings). GRASS GIS can be controlled via Python code, so it would be a simple matter to write a Python wrapper around the underlying modules, that could export the results to your web application.
For small datasets, the R project has several functions for reading/writing spatial data, and computing kernel density estimates.
Upvotes: 5

Reputation: 14571
I'll assume this is data with three values per data-point - we'll call them x, y and z. It would really help if x and y were spatial coordinates as that makes things easier.
Anyway, generate a bitmap of x by y (scaled appropriately).
For each x and y pair in the data, scale z to between 0 and 1 (or 0 and however many colours you have in your map), and plot z as a colour represented by that value. E.g. a simple map could just use the R portion of RGB, in which case you'd have 256 graduations for your red.
Most likely, you'd want something more fancy, but you should be able to get the idea.
If your datapoints are spread apart, you can either plot them as rectangles that take up the space, or smoothly interpolate between them.
NOTE: THere is a web-based tool that does it here. I found it linked from the Wikipedia article on heatmaps. There's a java one too linked from there too.
Upvotes: 3
Related Questions
- How to implement heatmap?
- How do website heatmaps get accurate data?
- Responsive Heatmaps
- Good examples of MapServer / OpenLayers
- HeatMap for User History Tracking
- Open Web Analytics; correct implementation of heatmaps anyone?
- Profiling Java WebApps
- jQuery Heatmap?
- Heat Map Testing - How should it affect modern web design?
- A Value Based Heatmap Algorithm