
Reputation: 2102
p:chart zoom with date/time axis shows nothing
I have problem to set the zoom on a chart with "date time" axis. I made a simulation comparing the chart of Primefaces with native jqplot. With jqplot native works fine, but with primefaces not.
It seems to me an bug in the calculation of the viewport.
My JSF page:
<p:chart type="line" model="#{chartController.model}" id="chart" style="height: 400px" />
My managed bean:
@Named(value = "chartController")
@ViewScoped
public class ChartController implements Serializable {
private LineChartModel model;
public ChartController() {
}
@PostConstruct
public void init() {
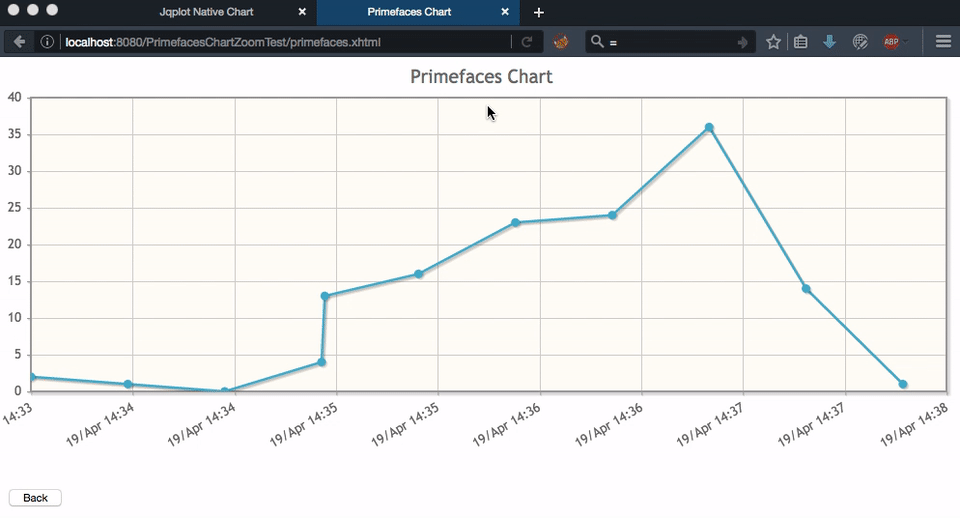
long[][] lines = {{1334856823000l, 2}, {1334856853000l, 1}, {1334856883000l, 0}, {1334856913000l, 4}, {1334856914000l, 13},
{1334856943000l, 16}, {1334856973000l, 23}, {1334857003000l, 24}, {1334857033000l, 36}, {1334857063000l, 14}, {1334857093000l, 1}};
model = new LineChartModel();
model.setTitle("Primefaces Chart");
model.setZoom(true);
LineChartSeries series = new LineChartSeries();
for (long[] line : lines) {
series.set(line[0], line[1]);
}
DateAxis xaxis = new DateAxis();
xaxis.setTickFormat("%e/%b %H:%M");
xaxis.setTickAngle(-30);
xaxis.setMin(1334856823000l); // if not set this, chart not work
model.getAxes().put(AxisType.X, xaxis);
Axis yaxis = new LinearAxis();
yaxis.setMin(0);
model.getAxes().put(AxisType.Y, yaxis);
model.addSeries(series);
}
public LineChartModel getModel() {
return model;
}
}
My jqplot native code:
<div id="chart" style="height: 400px"></div>

<script>

    $(document).ready(function () {
        $.jqplot.config.enablePlugins = true;

        var lines = [[1334856823000, 2], [1334856853000, 1], [1334856883000, 0], [1334856913000, 4], [1334856914000, 13],
            [1334856943000, 16], [1334856973000, 23], [1334857003000, 24], [1334857033000, 36], [1334857063000, 14], [1334857093000, 1]];

        $.jqplot('chart', [lines], {
            title: "Jqplot Native",
            axes: {
                xaxis: {
                    renderer: $.jqplot.DateAxisRenderer,
                    tickRenderer: $.jqplot.CanvasAxisTickRenderer,
                    tickOptions: {
                        formatString: '%e/%b %H:%M',
                        angle: -30
                    }
                },
                yaxis: {
                    renderer: $.jqplot.LinearAxisRenderer,
                    tickRenderer: $.jqplot.CanvasAxisTickRenderer,
                    min: 0
                }
            },
            cursor: {zoom: true}
        });

    });

</script>
The sample project is: https://github.com/douglasjunior/PrimefacesChartZoomTest
- Primefaces: 5.3
- Java EE: 7.0
- GlassFish: 4.1.1
I am researching a few days ago. What am I doing wrong? It's a limitation?
# UPDATE 2016-08-03:
Same problem with Primefaces 6.0
# UPDATE 2016-09-01:
Based on @lalitha ramakrishnan answer I make it work just including the jqplot.dateAxisRenderer.min.js file in xhtml page. For some bug, the Primefaces dont includes this automatically.
But now the lines was always smooth=true. I tried configure by lineSeries.setSmoothLine(false) and with extender, but not worked.
Bug report: https://github.com/primefaces/primefaces/issues/1736
Upvotes: 2
Views: 1730
Answers (1)

Reputation: 107
You can specify xaxis renderer of your primefaces chart model to be $.jqplot.DateAxisRenderer in the javascript.
The following script will be invoked when model's extender property is set to "ext".
model.setExtender("ext");
function ext() {
//this = chart widget instance
//this.cfg = options
 this.cfg.axes = {
    xaxis : {
        renderer : $.jqplot.DateAxisRenderer,
        tickRenderer : $.jqplot.CanvasAxisTickRenderer,
        tickOptions : {
            formatString : "%b %#d, %H:%M:%S",
            angle : -30
        },
        drawMajorGridlines : false
    },
    yaxis : {
        // Other Options for Y Axis
    }
};
}
See Also
How to solve primefaces xAxis overlapping Issue?
EDIT: You need to include jqplot.dateAxisRenderer.min.js file in your xhtml page.
Upvotes: 1
Related Questions
- Highcharts create custom yAxis labels
- p:chart with DateTime axis
- Dynamically display the x-axis labels in the datatip of p:chart (bar)
- extjs6 chart, create multiple lines dynamically
- PrimeFaces print doesn't work with p:chart
- Newline character %n in jqplot.dateAxisRenderer tick format options does not work
- jqPlot date axis - bars drawn on wrong day?
- Problems with jqPlot / Primefaces extender and Date values
- Tick label breaking(word-wrap)