Reputation:
OxyPlot: Plotting several graphs on one window using OxyPlot and WindowsForms
I've been using OxyPlot for one of the projects I'm currently working on, and it's worked very well. However, I have been unable to solve the issue of plotting multiple graphs in one window. My goal is to be able to do something like this.
My current single plot looks like this.
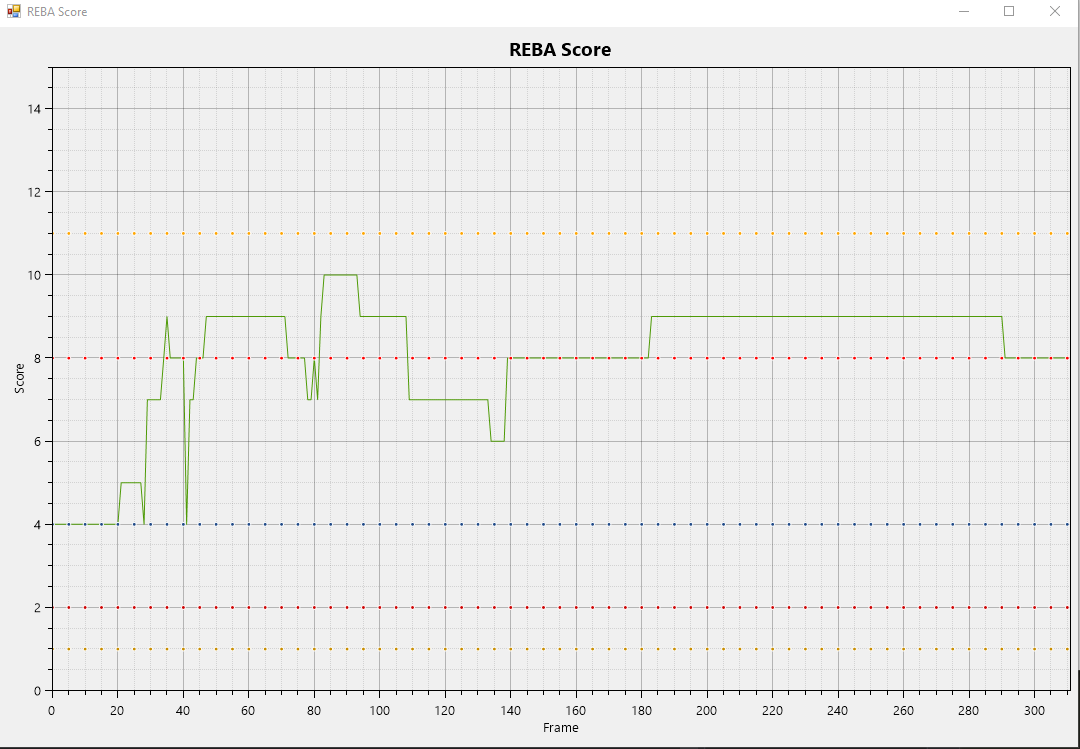
Here is some of my code
        var myModel = new PlotModel { Title = "REBA Score" };

        myModel.Axes.Add(new LinearAxis { Position = AxisPosition.Bottom, MajorGridlineStyle = LineStyle.Solid, MinorGridlineStyle = LineStyle.Dot, Minimum = 0, Maximum = a_count, Title = "Frame" });
        myModel.Axes.Add(new LinearAxis { Position = AxisPosition.Left, MajorGridlineStyle = LineStyle.Solid, MinorGridlineStyle = LineStyle.Dot, Minimum = 0, Maximum = 15, Title = "Score" });


        var series1 = new LineSeries
        {
            StrokeThickness = 1,
            MarkerSize = 1,
        };

        for (int i = 0; i < a_count; i++)
        {
            int x_val = i;
            int y_val = scores[0, i]; //"scores" is an array with my data

            series1.Points.Add(new DataPoint(x_val, y_val));

        }

        myModel.Series.Add(series1);


        this.plot1.Model = myModel //plot1 is an object of PlotView
What I want to do is use the same method of "Create linear series -> fill -> plot" for several different arrays of data and have it display as mentioned before. I am using WindowsForms and OxyPlot for this project.
Upvotes: 2
Views: 5376
Answers (3)

Reputation: 1
As i faced the same problem, i want to suggest my solution to this topic. If you want to plot more than one graph (with different scales) in one Plotview you don't need to create a new Plotview everytime. just assign a "AxisKey" for the axis you want to add the new graph to.
for example: These are the axes:
Dim xAxes As New OxyPlot.Axes.DateTimeAxis()
With xAxes
    .Key = "x_first_Time"
    .Position = Axes.AxisPosition.Bottom
    .StringFormat = "HH:mm:ss"
    .Unit = "ms"
    .Title = "Zeitintervall"
    .TitleFont = "Arial"
    .TitleFontSize = 18.0!
    .TitleFontWeight = FontWeights.Bold
    .MajorGridlineStyle = LineStyle.Dot
    .MajorGridlineThickness = 0.5

End With
model.Axes.Add(xAxes)

Dim yAxestemp As New OxyPlot.Axes.LinearAxis()
With yAxestemp
    .Position = Axes.AxisPosition.Left
    .Unit = "deg Celsius"
    .Key = "y_first_Temp"
    .TitlePosition = 0.5
    .AxisTitleDistance = 10
    .Title = "Temperatur "
    .TitleFont = "Arial"
    .TitleFontSize = 18.0!
    .TitleFontWeight = FontWeights.Bold
    .MajorGridlineStyle = LineStyle.Dot
    .MajorGridlineThickness = 0.5

End With
model.Axes.Add(yAxestemp)

Dim yAxesRPM As New OxyPlot.Axes.LinearAxis()
With yAxesRPM
    .Position = Axes.AxisPosition.Right
    .Unit = "1/min"
    .Key = "y_second_RPM"
    .TitlePosition = 0.5
    .AxisTitleDistance = 10
    .Title = "Drehzahl "
    .TitleFont = "Arial"
    .TitleFontSize = 18.0!
    .TitleFontWeight = FontWeights.Bold

End With
model.Axes.Add(yAxesRPM)
Plot.Model = model
And the Series looking like this:
With Sensor1series
    .Title = "Sensor_1"
    .YAxisKey = "y_first_Temp"
End With
model.Series.Add(Sensor1series)

With Sensor2series
    .Title = "Sensor_2"
    .YAxisKey = "y_first_Temp"
End With
model.Series.Add(Sensor2series)

With Sensor3series
    .Title = "Sensor_3"
    .YAxisKey = "y_first_Temp"
End With
model.Series.Add(Sensor3series)

With Sensor4series
    .Title = "Sensor_4"
    .YAxisKey = "y_first_Temp"
End With
model.Series.Add(Sensor4series)

With drehzahlseries
    .Title = "Drehzahl [rpm]"
    .LineStyle = LineStyle.Dot
    .YAxisKey = "y_second_RPM"
End With
model.Series.Add(drehzahlseries)
To fill those Series with some Data i created a list with data in another class. This is the example for filling the Series:
Sensor1series.Points.Add(New OxyPlot.DataPoint(Time, Datalist.Last.tempvalue1))
Sensor2series.Points.Add(New OxyPlot.DataPoint(Time, Datalist.Last.tempvalue2))
Sensor3series.Points.Add(New OxyPlot.DataPoint(Time, Datalist.Last.tempvalue3))
Sensor4series.Points.Add(New OxyPlot.DataPoint(Time, Datalist.Last.tempvalue4))
drehzahlseries.Points.Add(New OxyPlot.DataPoint(Time, Datalist.Last.RPM))
TextBox_Time.Text = Datalist.Last.time.ToString()
This should like this, with the Rpm on the secondary axis.

Upvotes: 0

Reputation: 1257
I used a TableLayoutPanel to arrange separate plots in different rows and columns. I'm planning to programmatically add graphs, so I can add rows and dock them in the layout.
Upvotes: 0
Reputation:
Here is what I did using bgura's recommendation.
I first created multiple PlotView's and set their properties. I changed their size so they would not take up the entire window, and I made sure to comment out the line where the "Dock" property was set to fill, since that caused the change in size to have no effect. You can then adjust the size of the Form and the individual PlotView's to achieve the multi-plot affect.
    private OxyPlot.WindowsForms.PlotView plot1;
    private OxyPlot.WindowsForms.PlotView plot2;
    private OxyPlot.WindowsForms.PlotView plot3;


         private void InitializeComponent()
    {
        this.plot1 = new OxyPlot.WindowsForms.PlotView();
        this.plot2 = new OxyPlot.WindowsForms.PlotView();
        this.plot3 = new OxyPlot.WindowsForms.PlotView();
        this.SuspendLayout();
        //
        // plot1
        //
        //this.plot1.Dock = System.Windows.Forms.DockStyle.Fill;
        this.plot1.Location = new System.Drawing.Point(0, 0);
        this.plot1.Name = "plot1";
        this.plot1.PanCursor = System.Windows.Forms.Cursors.Hand;
        this.plot1.Size = new System.Drawing.Size(300, 300);
        this.plot1.TabIndex = 0;
        this.plot1.Text = "plot1";
        this.plot1.ZoomHorizontalCursor = System.Windows.Forms.Cursors.SizeWE;
        this.plot1.ZoomRectangleCursor = System.Windows.Forms.Cursors.SizeNWSE;
        this.plot1.ZoomVerticalCursor = System.Windows.Forms.Cursors.SizeNS;
        //
        // plot2
        //
        //this.plot2.Dock = System.Windows.Forms.DockStyle.Fill;
        this.plot2.Location = new System.Drawing.Point(300, 0);
        this.plot2.Name = "plot2";
        this.plot2.PanCursor = System.Windows.Forms.Cursors.Hand;
        this.plot2.Size = new System.Drawing.Size(300, 300);
        this.plot2.TabIndex = 0;
        this.plot2.Text = "plot2";
        this.plot2.ZoomHorizontalCursor = System.Windows.Forms.Cursors.SizeWE;
        this.plot2.ZoomRectangleCursor = System.Windows.Forms.Cursors.SizeNWSE;
        this.plot2.ZoomVerticalCursor = System.Windows.Forms.Cursors.SizeNS;
        //
        // plot3
        //
        //this.plot3.Dock = System.Windows.Forms.DockStyle.Fill;
        this.plot3.Location = new System.Drawing.Point(900, 600 );
        this.plot3.Name = "plot3";
        this.plot3.PanCursor = System.Windows.Forms.Cursors.Hand;
        this.plot3.Size = new System.Drawing.Size(300,300);
        this.plot3.TabIndex = 0;
        this.plot3.Text = "plot3";
        this.plot3.ZoomHorizontalCursor = System.Windows.Forms.Cursors.SizeWE;
        this.plot3.ZoomRectangleCursor = System.Windows.Forms.Cursors.SizeNWSE;
        this.plot3.ZoomVerticalCursor = System.Windows.Forms.Cursors.SizeNS;
        //
        // Form1
        //
        this.AutoScaleDimensions = new System.Drawing.SizeF(6F, 13F);
        this.AutoScaleMode = System.Windows.Forms.AutoScaleMode.Font;
        this.ClientSize = new System.Drawing.Size(1225, 900);
        this.Controls.Add(this.plot3);
        this.Controls.Add(this.plot1);
        this.Controls.Add(this.plot2);
        this.Name = "Form1";
        this.Text = "plot3 Score";
        this.ResumeLayout(false);

    }
I then created multiple PlotModel's and filled them with data, and assigned them to their corresponding PlotView's:
        this.InitializeComponent();

        //Setup plot1
        var plot1_model = new PlotModel { Title = "plot1 Score" };

        plot1_model.Axes.Add(new LinearAxis { Position = AxisPosition.Bottom, MajorGridlineStyle = LineStyle.Solid, MinorGridlineStyle = LineStyle.Dot, Minimum = 0, Maximum = a_count, Title = "Frame" });
        plot1_model.Axes.Add(new LinearAxis { Position = AxisPosition.Left, MajorGridlineStyle = LineStyle.Solid, MinorGridlineStyle = LineStyle.Dot, Minimum = 0, Maximum = 15, Title = "Score" });


        var plot1_Series = new LineSeries { StrokeThickness = 1, MarkerSize = 1 };

        for (int i = 0; i < a_count; i++)
        {
            int x_val = i;
            int y_val = your_data[0, i];

            plot1_Series.Points.Add(new DataPoint(x_val, y_val));

        }

        plot1_model.Series.Add(plot1_Series);

        //Setup plot2
        var plot2_Model = new PlotModel { Title = "plot2 Score" };

        plot2_Model.Axes.Add(new LinearAxis { Position = AxisPosition.Bottom, MajorGridlineStyle = LineStyle.Solid, MinorGridlineStyle = LineStyle.Dot, Minimum = 0, Maximum = a_count, Title = "Frame" });
        plot2_Model.Axes.Add(new LinearAxis { Position = AxisPosition.Left, MajorGridlineStyle = LineStyle.Solid, MinorGridlineStyle = LineStyle.Dot, Minimum = 0, Maximum = 15, Title = "Score" });


        var plot2_Series = new LineSeries { StrokeThickness = 1, MarkerSize = 1 };

        for (int i = 0; i < a_count; i++)
        {
            int x_val = i;
            int y_val = your_data[1, i];

            plot2_Series.Points.Add(new DataPoint(x_val, y_val));

        }

        plot2_Model.Series.Add(plot2_Series);


        //Setup plot3
        var plot3_Model = new PlotModel { Title = "plot3 Score" };

        plot3_Model.Axes.Add(new LinearAxis { Position = AxisPosition.Bottom, MajorGridlineStyle = LineStyle.Solid, MinorGridlineStyle = LineStyle.Dot, Minimum = 0, Maximum = a_count, Title = "Frame" });
        plot3_Model.Axes.Add(new LinearAxis { Position = AxisPosition.Left, MajorGridlineStyle = LineStyle.Solid, MinorGridlineStyle = LineStyle.Dot, Minimum = 0, Maximum = 15, Title = "Score" });


        var plot3_Series = new LineSeries{ StrokeThickness = 1, MarkerSize = 1};

        for (int i = 0; i < a_count; i++)
        {
            int x_val = i;
            int y_val = your_data[3, i];

            plot3_Series.Points.Add(new DataPoint(x_val, y_val));

        }
        this.plot1.Model = plot1_Model;
        this.plot2.Model = plot2_model;
        this.plot3.Model = plot3_Model;
Hopefully this can help someone who needs to implement the same feature. In case anyone was wondering, I pretty much used the HelloWorld program from the OxyPlot documentation and added onto that. That can be found here
Upvotes: 2