
Reputation: 792
iOS Metal: How to Capture GPU Frame properly?
I'm trying to profile Metal kernels by capturing GPU frame. In an application with Metal runloop I'd click on the "camera button" in the Debug area, however I only dispatch the kernels exactly once per application lifetime, thus I cannot click the "camera button" (it stays grayed out).
Because of this, I've tried to solve this problem by setting a breakpoint with action "Capture GPU Frame" before the first call of mQueue.insertDebugCaptureBoundary() (see the code below).
What I expect to happen is something like this – i.e. an overview of execution duration of each kernel function with denoted percentages of time spent on executing individual lines of kernel functions.
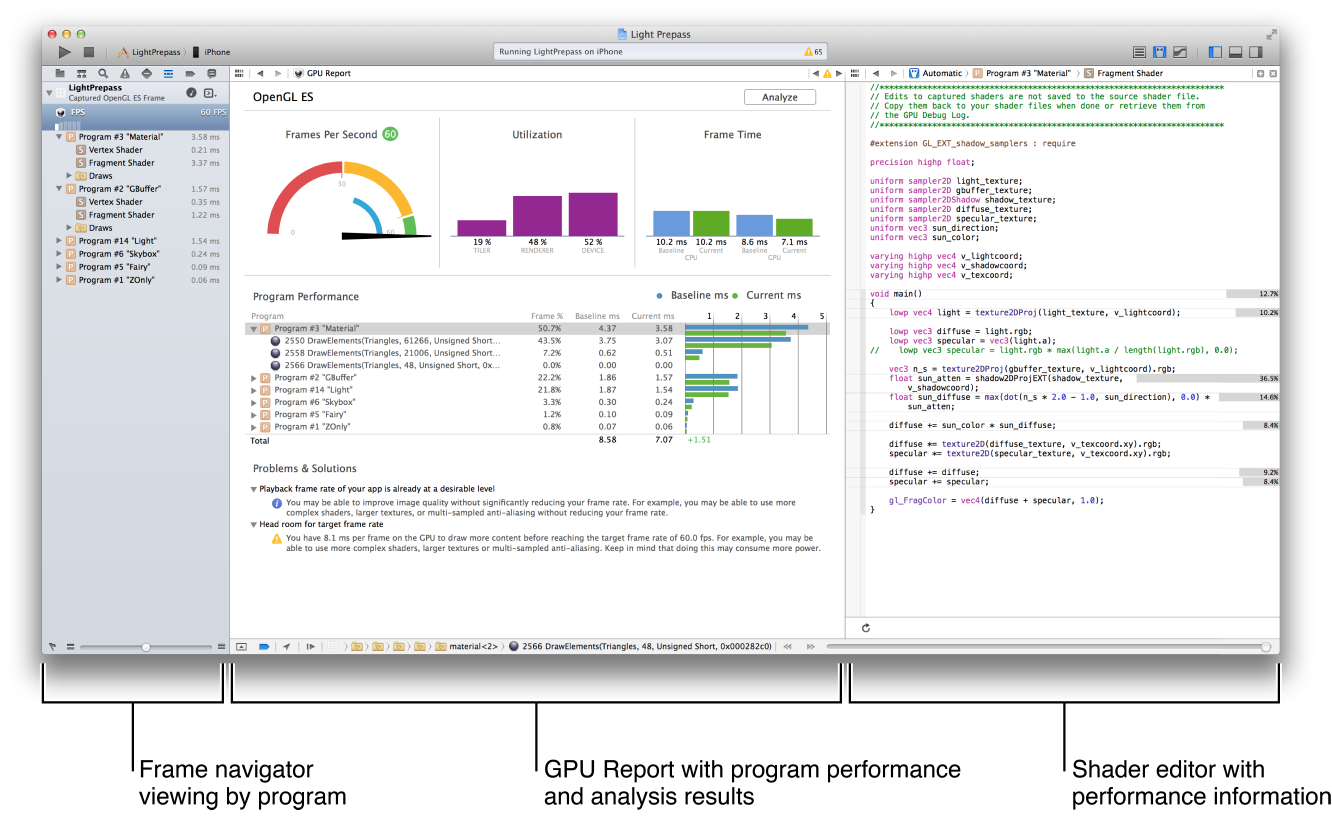
What actually happens is: I get the described expected profiling overview very rarely. Most of the time (about 95% of time) I don't get such an profiling overview, but instead one of the following happens after I build and run the app:
- No "Debugging GPU Frame" window gets displayed – only the Status bar of XCode changes to "Capturing GPU Frame" with active spinner; illustration here.
- The "Debugging GPU Frame" window gets displayed, however there're NO encoded commands showed, hence no execution times are shown and no GPU objects browser is present (by objects I mean MTLBuffers and MTLTextures); illustration here.
- A titleless XCode window pops out saying "timed out (5)" and nothing else happens; illustration here.
The code below shows a simplified example of my problem (in case you are wondering; no, I don't have the computation logic in a ViewController - the code below is just a toy example ;)).
class ViewController : UIViewController {
  // initialize Metal, create buffers, etc.

  override func viewDidLoad() {
    tick() // called exactly once – how to profile the the kernels?
  }

  func tick() {
      // On this (empty) line, there's set a breakpoint with the action "Capture GPU Frame"
      mQueue.insertDebugCaptureBoundary() // start frame capture here
      let cmdBuff = mQueue.commandBuffer()
      let compEnc = cmdBuff.computeCommandEncoder()

      // ------- Dispatch several kernels -------
      compEnc.setComputePipelineState(foo)
      compEnc.setBuffer(..., offset: 0, atIndex: 0)
      compEnc.setBuffer(..., offset: 0, atIndex: 1)
      // ...
      compEnc.dispatchThreadgroups(..., ...)


      compEnc.setComputePipelineState(bar)
      compEnc.setBuffer(..., offset: 0, atIndex: 0)
      compEnc.setBuffer(..., offset: 0, atIndex: 1)
      // ...
      compEnc.dispatchThreadgroups(..., ...)
      // ------- /Dispatch several kernels -------

      compEnc.endEncoding()
      cmdBuff.commit()
      cmdBuff.waitUntilCompleted()

      mQueue.insertDebugCaptureBoundary() // end the frame capture here
  }

}
Upvotes: 3
Views: 5128
Answers (1)
Reputation: 792
In iOS 11 we can use the MTLCaptureManager to reliably capture even one invocation of a compute kernel.
When you run the example below, it starts capturing. You can stop the capture either via the Xcode's "GPU Capture button" (see the image) or programmatically via MTLCaptureManager's stopCapture() method.

// 1. First create the Metal device and command queue
let dev   = MTLCreateSystemDefaultDevice()!
let queue = dev.makeCommandQueue()!

// 2. Access the shared MTLCaptureManager and start capturing
let capManager = MTLCaptureManager.shared()
capManager.startCapture(commandQueue: queue)

// 3. Encode commands into the queue
let cmdbuff = queue.makeCommandBuffer()!
let enc     = cmdbuff.makeComputeCommandEncoder()!

// encode your kernel

enc.endEncoding()
cmdbuff.commit()
Upvotes: 5
Related Questions
- How to capture a metal shader frame programmatically?
- MacOS Metal: Failing to capture GPU Frame from command line app
- Debugging Metal compute shaders with Xcode
- GPU Frame Capture is "Not Available" On Simulator?
- Metal Shader Debugging - Capture GPU Frame
- Enabling GPU Frame Capture
- What is the meaning of some parameters in metal by using xcode GPU capture?
- 'Capture GPU frame' first frame for iOS app
- How to request use of integrated GPU when using Metal API?
- "Capture GPU Frame" in XCode -- iOS only?