Lindy Leigh
Reputation: 79
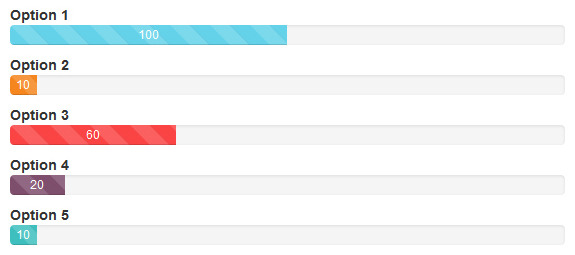
Highcharts Progress Bar Chart
Is it possible to create a progress chart in Highcharts like this:
https://0.s3.envato.com/files/84221450/screenshots/weblator_responsive_charts_7_bootstrap.jpg
I believe a bar chart can be customized to create this. But is it possible to change the styling so that no axes are showing and the bar labels are positioned above the bars rather than preceding them?
Upvotes: 4
Views: 5173
Answers (1)

Deep 3015
Reputation: 10075
Possible to recreate but it is not so dynamic( in style ). So you have to adjust css according to data series in chart.
var chart = new Highcharts.Chart({
  chart: {
    renderTo: 'container',
    type: 'bar',

    marginBottom: 120
  },
  legend: {
    enabled: false
  },
  colors: ['#173c64'],
  xAxis: {
    categories: ['option 1', 'option 2', 'option 3', 'option 4 ', 'option 5 '],
    labels: {
      align: 'left',
      x: 5,
      y: -20, /* to be adjusted according to number of bars*/
      style: {
       fontSize: "1rem",
        color: '#000'
      }
    },
    lineWidth: 0,
    gridLineWidth: 0,
    lineColor: 'transparent',
    minorTickLength: 0,
    tickLength: 0,
    title: {
      enabled: false
    }

  },
  yAxis: {
    lineWidth: 0,
    gridLineWidth: 0,
    lineColor: 'transparent',
    labels: {
      enabled: false
    },
    minorTickLength: 0,
    tickLength: 0,
    title: {
      enabled: false
    }
  },
  plotOptions: {
    bar: {
      stacking: "normal",
      //groupPadding: 0, //add here
      //pointPadding: 0, //add here,
      dataLabels: {
        enabled: true,
        color: (Highcharts.theme && Highcharts.theme.dataLabelsColor) || 'white'
      }
    }
  },
  title: {
    margin: 0,
    useHTML: true,
    text: "Test",
    style: {
      "color": "#333333",
      "fontSize": "1.5rem",
      "fontWeight": "bold"
    }
  },

  series: [{
    data: [{
      y: 100,
      color: '#99ddff'
    }, {
      y: 10,
      color: '#ff8c1a'
    }, {
      y: 20,
      color: '#ff471a'
    }, {
      y: 60,
      color: '#c299ff'
    }, {
      y: 10,
      color: '#99ddff'
    }]
  }]
})
<script src="https://code.highcharts.com/highcharts.js"></script>
<script src="https://code.highcharts.com/modules/exporting.js"></script>
<div id="container" style="min-width: 310px; height: 400px; margin: 0 auto"></div>Upvotes: 4
Related Questions
- How do I present progress in an Angular bar chart?
- How to show circular progress pie chart using the highcharts
- Bar Chart Gauge Highcharts
- Highcharts Gantt milestone series
- Making Highcharts look like progress bar with more than one series
- High Chart progress bar/Status bar
- How to create bar chart using progress bar in AngularJS?
- How to show progrss bar in highchart while loading data?
- multiple radial-progress charts (js)
- Incremental Javascript / CSS bar chart