
Reputation: 7720
How to rotate a table left margin name with knitr and xtable?
I'm trying to get the results of the table command nicely printed on a pdf by using knitr and xtable.
As a toy example let's say I want to get the table created with
table(c(2,5,5,5,5,7,7,7,7,NA),c(1,5,2,2,2,2,7,7,NA,NA))
I would like to get something like this:
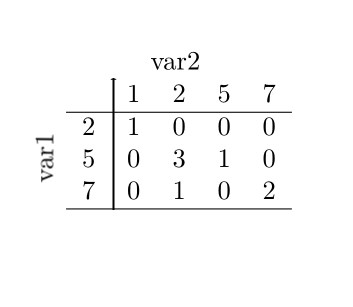
As you can see var1 is rotated 90 degrees counterclockwise.
How can I get it?
Similar results, with less or more lines are OK too.
I've being trying different methods I've found.
I've created this Rnw file,
\documentclass{article}
\usepackage{booktabs}
\usepackage{rotating}
\begin{document}

<<r table, results='asis', echo=FALSE>>=
library(knitr)
library(xtable)
var1 <- c(2,5,5,5,5,7,7,7,7,NA)
var2 <- c(1,5,2,2,2,2,7,7,NA,NA)

print(xtable(table(var1,var2)))

print.xtableFtable(xtableFtable(ftable(var1,var2),
       method = "row.compact"))

print.xtableFtable(xtableFtable(ftable(var1,var2),
       method = "row.compact"), rotate.rownames = TRUE)

print.xtable(xtable(table(var1,var2)), include.rownames=T,include.colnames=T)

@

\end{document}
You can see below the result of the three methods I've tried.
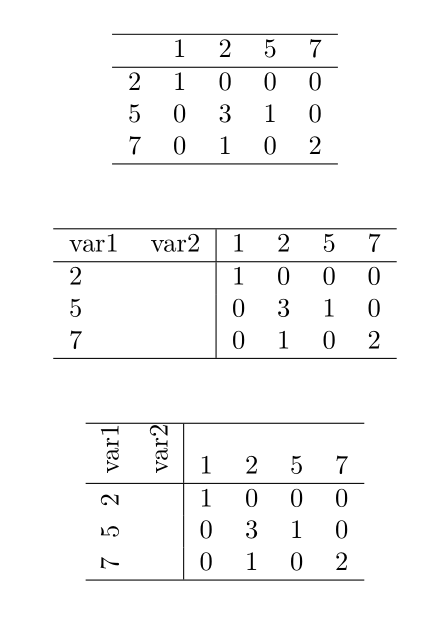
I can't get the expected result.
Any solution with other common package or kable it's OK too.
I guess it could be done with \rotatebox{90} but I don't know how to force xtable to use it nor how to tell xtable to place the left title on the left instead of just being on the top-right.
Upvotes: 0
Views: 339
Answers (1)
Reputation:
Here's one possibility. Disclaimer: I am the package author.
library(huxtable)
var1 <- c(2,5,5,5,5,7,7,7,7,NA)
var2 <- c(1,5,2,2,2,2,7,7,NA,NA)
tbl <- table(var1 = var1, var2 = var2)

ht <- as_hux(tbl)
ht <- cbind(rep('', 4), ht)

ht[2,1] <- 'var1'

ht <- rbind(rep('', 6), ht)
ht[2,2] <- '' # get rid of "rownames"
ht[1,3] <- 'var2'
colspan(ht)[1,3] <- 4
rowspan(ht)[3, 1] <- 3
rotation(ht)[3, 1] <- 90
right_border(ht)[,2] <- 1
bottom_border(ht)[5, -1] <- 1
bottom_border(ht)[2, -1] <- 1
ht
When used in an rmarkdown PDF document, this produces:

Upvotes: 1
Related Questions
- Rotate a table from R markdown in pdf
- Knitr Kable to retain top left name in table
- Rotating a table in PDF output from RMarkdown with more than one page
- Align xtable caption left in knitr
- In sweave, xtable, only rotate some column names
- How to place xtable object to the left side of page
- xtable and knitr: How to center table on full page width?
- R: diagonal columnnames in xtable
- Rotated xtable colnames with Tufte_handout in RMarkdown
- xtable rownames using R