
Reputation: 437
Postgres queries in production results in abnormally high disk read I/O
I'm using Ubuntu 16.04 with PostgreSQL 9.5 and Django 1.11
My website has been suffering from super long ajax calls (upwards of 30 seconds in some cases). The same ajax calls take about 500ms in development.
The problem is correlated with disk read I/O. Doing a single query in production drives the disk read I/O up to 25MB/s; an identical query in development results in less than 0.01 MB/s of disk read I/O. The code and query are identical in production/development.
So something with postgres in production is causing abnormally high disk read I/O. What could it be?
Here is an example query that takes ~25 seconds in production, and only 500ms in development:
EXPLAIN (ANALYZE, BUFFERS)
SELECT COUNT(*) AS "__count" FROM "map_listing"
WHERE ("map_listing"."lo" <  -79.32516245458987 AND "map_listing"."la" > 43.640279060122346
AND "map_listing"."lo" >  -79.60531382177737 AND "map_listing"."transaction_type" = 'Sale'
AND "map_listing"."la" < 43.774544561921296
AND NOT ("map_listing"."status" = 'Sld' AND "map_listing"."sold_date" < '2018-01-21'::date
AND "map_listing"."sold_date" IS NOT NULL)
AND NOT (("map_listing"."status" = 'Ter' OR "map_listing"."status" = 'Exp'))
AND NOT (("map_listing"."property_type" = 'Parking Space' OR "map_listing"."property_type" = 'Locker')));
Result of doing EXPLAIN (ANALYZE, BUFFERS) on the above statement (production):
 Aggregate  (cost=89924.55..89924.56 rows=1 width=0) (actual time=27318.859..27318.860 rows=1 loops=1)
   Buffers: shared read=73424
   ->  Bitmap Heap Scan on map_listing  (cost=4873.96..89836.85 rows=35079 width=0) (actual time=6061.214..27315.183 rows=3228 loops=1)
         Recheck Cond: ((la > 43.640279060122346) AND (la < 43.774544561921296))
         Rows Removed by Index Recheck: 86733
         Filter: ((lo < '-79.32516245458987'::numeric) AND (lo > '-79.60531382177737'::numeric) AND ((status)::text <> 'Ter'::text) AND ((status)::text <> 'Exp'::text) AND ((property_type)::text <> 'Parking Space'::text) AND ((property_type)::text <> 'Locker'::text) AND ((transaction_type)::text = 'Sale'::text) AND (((status)::text <> 'Sld'::text) OR (sold_date >= '2018-01-21'::date) OR (sold_date IS NULL)))
         Rows Removed by Filter: 190108
         Heap Blocks: exact=46091 lossy=26592
         Buffers: shared read=73424
         ->  Bitmap Index Scan on map_listing_la_88ca396c  (cost=0.00..4865.19 rows=192477 width=0) (actual time=156.964..156.964 rows=194434 loops=1)
               Index Cond: ((la > 43.640279060122346) AND (la < 43.774544561921296))
               Buffers: shared read=741
 Planning time: 0.546 ms
 Execution time: 27318.926 ms
(14 rows)
Result of EXPLAIN (ANALYZE, BUFFERS) (development):
 Aggregate  (cost=95326.23..95326.24 rows=1 width=8) (actual time=495.373..495.373 rows=1 loops=1)
   Buffers: shared read=77281
   ->  Bitmap Heap Scan on map_listing  (cost=5211.98..95225.57 rows=40265 width=0) (actual time=80.929..495.140 rows=4565 loops=1)
         Recheck Cond: ((la > 43.640279060122346) AND (la < 43.774544561921296))
         Rows Removed by Index Recheck: 85958
         Filter: ((lo < '-79.32516245458987'::numeric) AND (lo > '-79.60531382177737'::numeric) AND ((status)::text <> 'Ter'::text) AND ((status)::text <> 'Exp'::text) AND ((property_type)::text <> 'P
arking Space'::text) AND ((property_type)::text <> 'Locker'::text) AND ((transaction_type)::text = 'Sale'::text) AND (((status)::text <> 'Sld'::text) OR (sold_date >= '2018-01-21'::date) OR (sold_date
 IS NULL)))
         Rows Removed by Filter: 198033
         Heap Blocks: exact=49858 lossy=26639
         Buffers: shared read=77281
         ->  Bitmap Index Scan on map_listing_la_88ca396c  (cost=0.00..5201.91 rows=205749 width=0) (actual time=73.070..73.070 rows=205569 loops=1)
               Index Cond: ((la > 43.640279060122346) AND (la < 43.774544561921296))
               Buffers: shared read=784
 Planning time: 0.962 ms
 Execution time: 495.822 ms
(14 rows)
Upvotes: 3
Views: 3196
Answers (2)

Reputation: 246013
This query did not produce any disk I/O – all the blocks are read from shared buffers. But since the query reads 73424 blocks (about 574 MB), it will produce substantial I/O load when the table is not cached.
But there are two things that can be improved.
You have lossy block matches in the heap scan. That means that
work_memis not big enough to contain a bitmap with a bit per table row, and 26592 bits map a table block instead. All the rows have to be rechecked, and 86733 rows are discarded, most of which are false positives from the lossy block matches.If you increase
work_mem, a bitmap with a bit per table row will fit into memory, and this number will shrink, reducing the work during the heap scan.190108 rows are discarded because they do not match the additional filter condition in the bitmap heap scan. This is probably where most of the time is spent. If you can reduce that amount, you will win.
The ideal indexes for this query would be:
  CREATE INDEX ON map_listing(transaction_type, la);
  CREATE INDEX ON map_listing(transaction_type, lo);
If
transaction_typeis not very selective (i.e., most rows have the valueSale), you can omit that column.
EDIT:
Examination of vmstat and iostat shows that both CPU and the I/O subsystem are suffering from massive overload: all the CPU resources are spent on I/O wait and VM steal time. You need a better I/O system and a host system with more free CPU resources. Increasing RAM might alleviate the I/O problem, but only for the disk reads.
Upvotes: 2
Reputation: 306
(I don't yet have the privilege to comment)
I am currently having a problem similar to Jacks. My query was slowed down after create indexes, and my tweaking of work_mem and shared_buffers is not making any improvements.
When you say RAM was the issue, what did you do to fix it? My server har 32GB RAM, and I have even tried setting work_mem = 16GB.
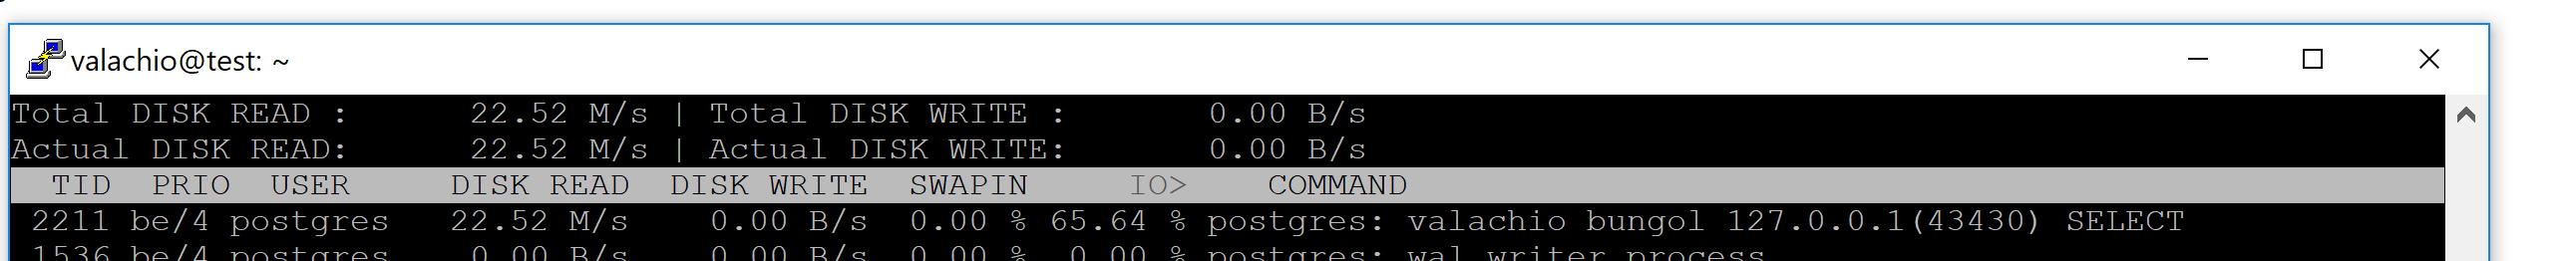
iotop reads:
DISK READ  DISK WRITE  SWAPIN     IO>    COMMAND
86.28 M/s    0.00 B/s  0.00 %   87.78 %  postgres
(Edit: link to my question on gis.stackexchange)
Upvotes: 1
Related Questions
- PostgreSQL suddently takes all the disk space
- Rapid increase in diskspace of postgres database due to WAL
- Postgres query making high disk IO after upgrade to version 11
- How to find postgresql query which is consuming the most I/O
- Postgres query: Abnormal Disk I/O
- Postgres queries intermittently running extremely slowly
- Getting abnormal I/O usage Postgresql and JBD2
- Why postgresql writes huge temporary files and fills my disk within a loop?
- Postgres 100% CPU. High write/read ops count rate
- PostgreSQL's magic with low free space on system drive