Reputation: 2386
Exponential distribution simulation in R
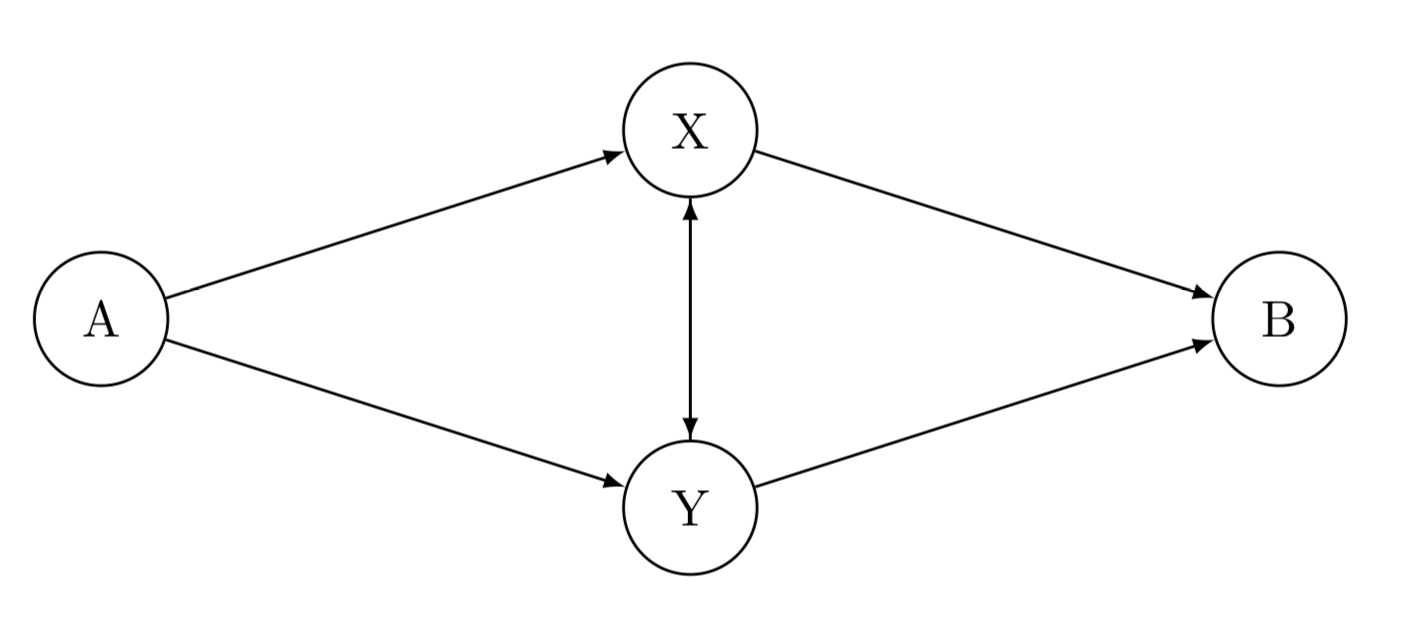
I have the following graph:
I am told the following information:
(1) vertex A to vertex X is described by an exponential distribution with lambda = 4;
(2) vertex A to vertex Y is described by an exponential distribution with lambda = 2.5;
(3) vertex X to vertex Y identical to vertex Y to vertex X, and it is described by an exponential distribution with lambda = 10;
(4) vertex X to vertex B is described by an exponential distribution with lambda = 3; and, finally,
(5) vertex Y to vertex B is described by an exponential distribution with lambda = 5.
Let's assume that I'm taking the fastest path between vertices every simulation.
I now want to know the average time it takes to get from vertex A to vertex B.
My R code is as follows:
# Generate/simulate 1000 random numbers for each of the internode paths.

            AtoX <- rexp(1000, 4)
            AtoY <- rexp(1000, 2.5)
            XtoY <- rexp(1000, 10)
            XtoB <- rexp(1000, 3)
            YtoB <- rexp(1000, 5)

    # Length of path from A to X to Y and A to Y to X.

            AYX = AtoY + XtoY
            AXY = AtoX + XtoY

    # Total time of paths from A to B.

            AXB = AtoX + XtoB
            AYB = AtoY + YtoB
            AXYB = AtoX + XtoY + YtoB
            AYXB = AtoY + XtoY + XtoB

    # Taking the fastest path of all paths.

            minAXB = min(AXB)
            minAYB = min(AYB)
            minAXYB = min(AXYB)
            minAYXB = min(AYXB)

    # Taking an average of the fastest paths.

            averageTravelTime =
              mean(minAXB + minAYB + minAXYB + minAYXB)
Does this look correct?
Upvotes: 4
Views: 334
Answers (1)

Reputation: 48211
It depends on the interpretation, but I'd say that you need to simulate times from X to Y and from Y to X separately, although with the same rate. If a train goes both ways and on average the speed is the same, it doesn't mean that two trains leaving from X and Y will arrive to the other point in the same time.
You are not using
AYX <- AtoY + XtoY
AXY <- AtoX + XtoY
so they are redundant.
Writing
minAXB <- min(AXB)doesn't really make sense. You simulate 1000 travel times for each edge,AXBis a vector of 1000 times of routeAXBand now you are choosing the shortest one across the time..Similarly,
averageTravelTimedoesn't make sense becauseminAXB + minAYB + minAXYB + minAYXBis just a number, not a vector.
Hence, I think the code should be
set.seed(1)
AtoX <- rexp(1000, 4)
AtoY <- rexp(1000, 2.5)
XtoY <- rexp(1000, 10)
YtoX <- rexp(1000, 10) # added
XtoB <- rexp(1000, 3)
YtoB <- rexp(1000, 5)

AXB <- AtoX + XtoB
AYB <- AtoY + YtoB
AXYB <- AtoX + XtoY + YtoB
AYXB <- AtoY + YtoX + XtoB # changed XtoY to YtoX

TravelTimes <- pmin(AXB, AYB, AXYB, AYXB)
averageTravelTime <- mean(TravelTimes)
See ?pmin. For every day it chooses the fastest travel time and returns a vector of length 1000.
As a bonus, the following shows how many times which route was the fastest
table(apply(cbind(AXB, AYB, AXYB, AYXB), 1, which.min))
#   1   2   3   4
# 317 370 240  73
Upvotes: 3
Related Questions
- Create Simulation in R
- Calculating probabilities of simulated random variables in R
- Loop in a dataset simulation
- Generate random numbers from an exponential distribution
- Exponential distribution in R
- How to set up an exponential distribution?
- How to simulate from poisson distribution using simulations from exponential distribution
- Defining exponential distribution in R to estimate probabilities
- How to plot an exponential distribution
- Finding the distribution through random number generation in R
