
KaC
Reputation: 287
Histogram with two variables in ggplot
I have a dataframe with two variables:
DF <- data.frame(Now = as.numeric(c(1, 6, 4, 4, 5, 6)), Before = as.numeric(c(1, 6, 3, 5, 10, 10)))
I can easily plot both variables separately:
library(ggplot2)
ggplot(DF, aes(Now))+
  geom_histogram()
ggplot(DF, aes(Before))+
  geom_histogram()
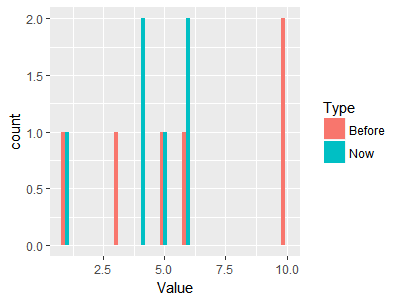
But I would like to plot both variables together, so that the change between Before and Now is easy to see. One way to do this is described in an answer here: Plot two variables in the same histogram with ggplot. But I would much rather have one plot with differently colored bars side-by-side. How can this be done? (Side note: if it's easier to do with geom_bar than geom_histogram, that works for me too.)
Upvotes: 2
Views: 23116
Answers (1)

Andrew Gustar
Reputation: 18435
You need to convert DF to long format using something like tidyr::gather...
library(tidyr)
library(ggplot2)

DF %>%
  gather(key=Type, value=Value) %>%
  ggplot(aes(x=Value,fill=Type)) +
  geom_histogram(position="dodge")
Upvotes: 1
Related Questions
- Plot a histogram using ggplot
- How to plot histogram with 2 variables
- Creating GGPLOT Histogram
- ggplot two histograms in one plot
- Simple histogram of two variables with ggplot
- R ggplot histogram with 2 variables
- Create histogram in ggplot with both x and y variables in R
- Histograms with ggplot
- Plot two variables in the same histogram with ggplot
- Plotting histogram using ggplot2 for 2 numbers