Reputation: 93
Prolem with lowpass butter filter in Python
I wanted to filter (lowpass) a signal i have, and when it did not work, i started investigating why it wouldn't. I have made a few tests and i am somewhat surprised by the behavior of the butterworth filter. i have defined it like in this post
def apply_filter(data, cutoff, fs, order=6, filter_type="low", analog=False):
    nyq = 0.5 * fs
    normalized_cutoff = cutoff / nyq
    b,a = butter(order, normalized_cutoff, btype=filter_type, analog=analog, output="ba")
    they = lfilter(b, a, data)
    return(they)
if i take a 1000 elements long sample, like so
x = np.linspace(0, 2*np.pi, 1000)
y = np.sin(x) + 0.3* np.sin(10*x)
sampling_frequency = 1/ (x[-1] * 1e-3)
sampling_frequency
>> 159.15494309189532
# because i have 1000 thousand points for a "time" going up to 2 pi

plt.plot(x, y, x, apply_filter(y, cutoff=1, fs= sampling_frequency)
to which i get

on the other hand, if i do the exact same thing but with a different number of points, say, 10000, i get a wrong result, and i don't quite understand why:
x = np.linspace(0, 2*np.pi, 10000)
y = np.sin(x) + 0.3* np.sin(10*x)
sampling_frequency = 1/ (x[-1] * 1e-4)
sampling_frequency
>> 1591.5494309189535
# because i have 10000 thousand points for a "time" going up to 2 pi

plt.plot(x, y, x, apply_filter(y, cutoff=1, fs= sampling_frequency)
and this time, i obtain

which is obviously wrong. Can someone explain why would that happen? things seem to function alright for 1000 points or less...
EDIT:
I have plotted the frequency response of the filter, and the problem appears on these graphs, although i don't know why it does that either.
sampling rate
>> 159.1549430918953
b, a = butter(6, 1/(sampling_rate/2))
w, h = freqz(b, a, 8000)
plt.subplot(2,1,1)
plt.xlim(0, 15)
plt.plot(0.5*sampling_rate*w/np.pi, np.abs(h))
to which i get 
whereas, if i do
sampling_frequency *= 10
sampling_frequency
>> 1591.5494309189535
b, a = butter(6, 1/(sampling_rate/2))
w, h = freqz(b, a, 8000)
plt.subplot(2,1,1)
plt.xlim(0, 15)
plt.plot(0.5*sampling_rate*w/np.pi, np.abs(h))
then i get 
I feel like the function butterworth is having some trouble with a high number of points for some reason perhaps?
thanks for your help!
Upvotes: 1
Views: 1067
Answers (1)
Reputation: 93
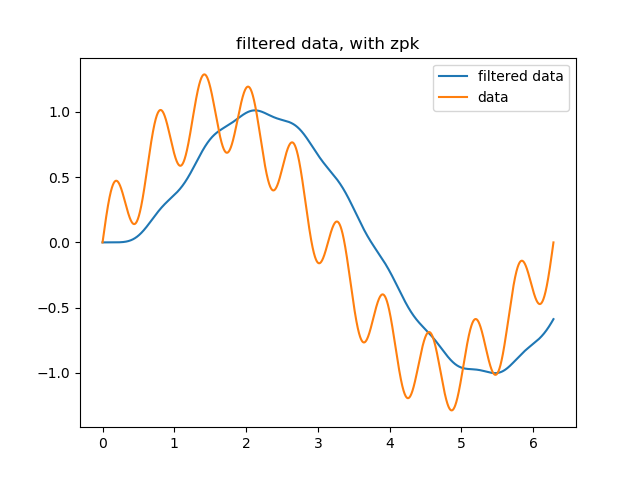
For whomever might be interested, this is actually a "known issue" with the butter filter used with the "ba" output. You should rather use the "zpk" output instead, see this link.
You may use the "zpk" output in a rather simple way, very similar to what you would do with the "ba" output. This seems to work for as many as 1million points, no reason for it not to work further on.
here's a basic exemple:
point_number=1000000
# our "data"
x = np.linspace(0, 2*np.pi, point_number)
y = sin(x) + 0.3* sin(10*x)

# sampling frequency would be 1/ sampling_time
sampling_frequency = point_number/(2*np.pi)
# hence the nyquist frequency
nyq = sampling_frequency/2
# desired cutoff frequency, in Hertz
cutoff = 1
# normalized for the function butter
normalized_cutoff = cutoff/nyq

z,p,k = butter(6, normalized_cutoff, output="zpk")
lesos = zpk2sos(z, p, k)
# filtered data
y_filtered_sos = sosfilt(lesos, y)

# plot part
plt.plot(x, y_filtered_sos, label="filtered data")
plt.title("filtered data, with zpk")
plt.plot(x,y, label="data")
plt.legend()
plt.title("filtered data, with zpk")
which gives

Upvotes: 1
Related Questions
- How to implement a butterworth filter
- How to implement band-pass Butterworth filter with Scipy.signal.butter
- Bandpass Butterworth filter frequencies in scipy
- signal.butter bandpass error: Digital filter critical frequencies must be 0 < Wn < 1
- Applying an suitable butterworth filter on raw signal using Python
- Why do I get an error using butterworth filter for low frequency filtering?
- Implementing (Butterworth) filter in Python and creating wav file
- Applying Butterworth High Pass Filter
- Butterworth Filter Using Scipy
- Butterworth filter in python