
Reputation: 1075
No timing breakdown in User Timing section in Performance tab in Chrome dev tools using React 16
I was following this article: https://calibreapp.com/blog/2017-11-28-debugging-react/
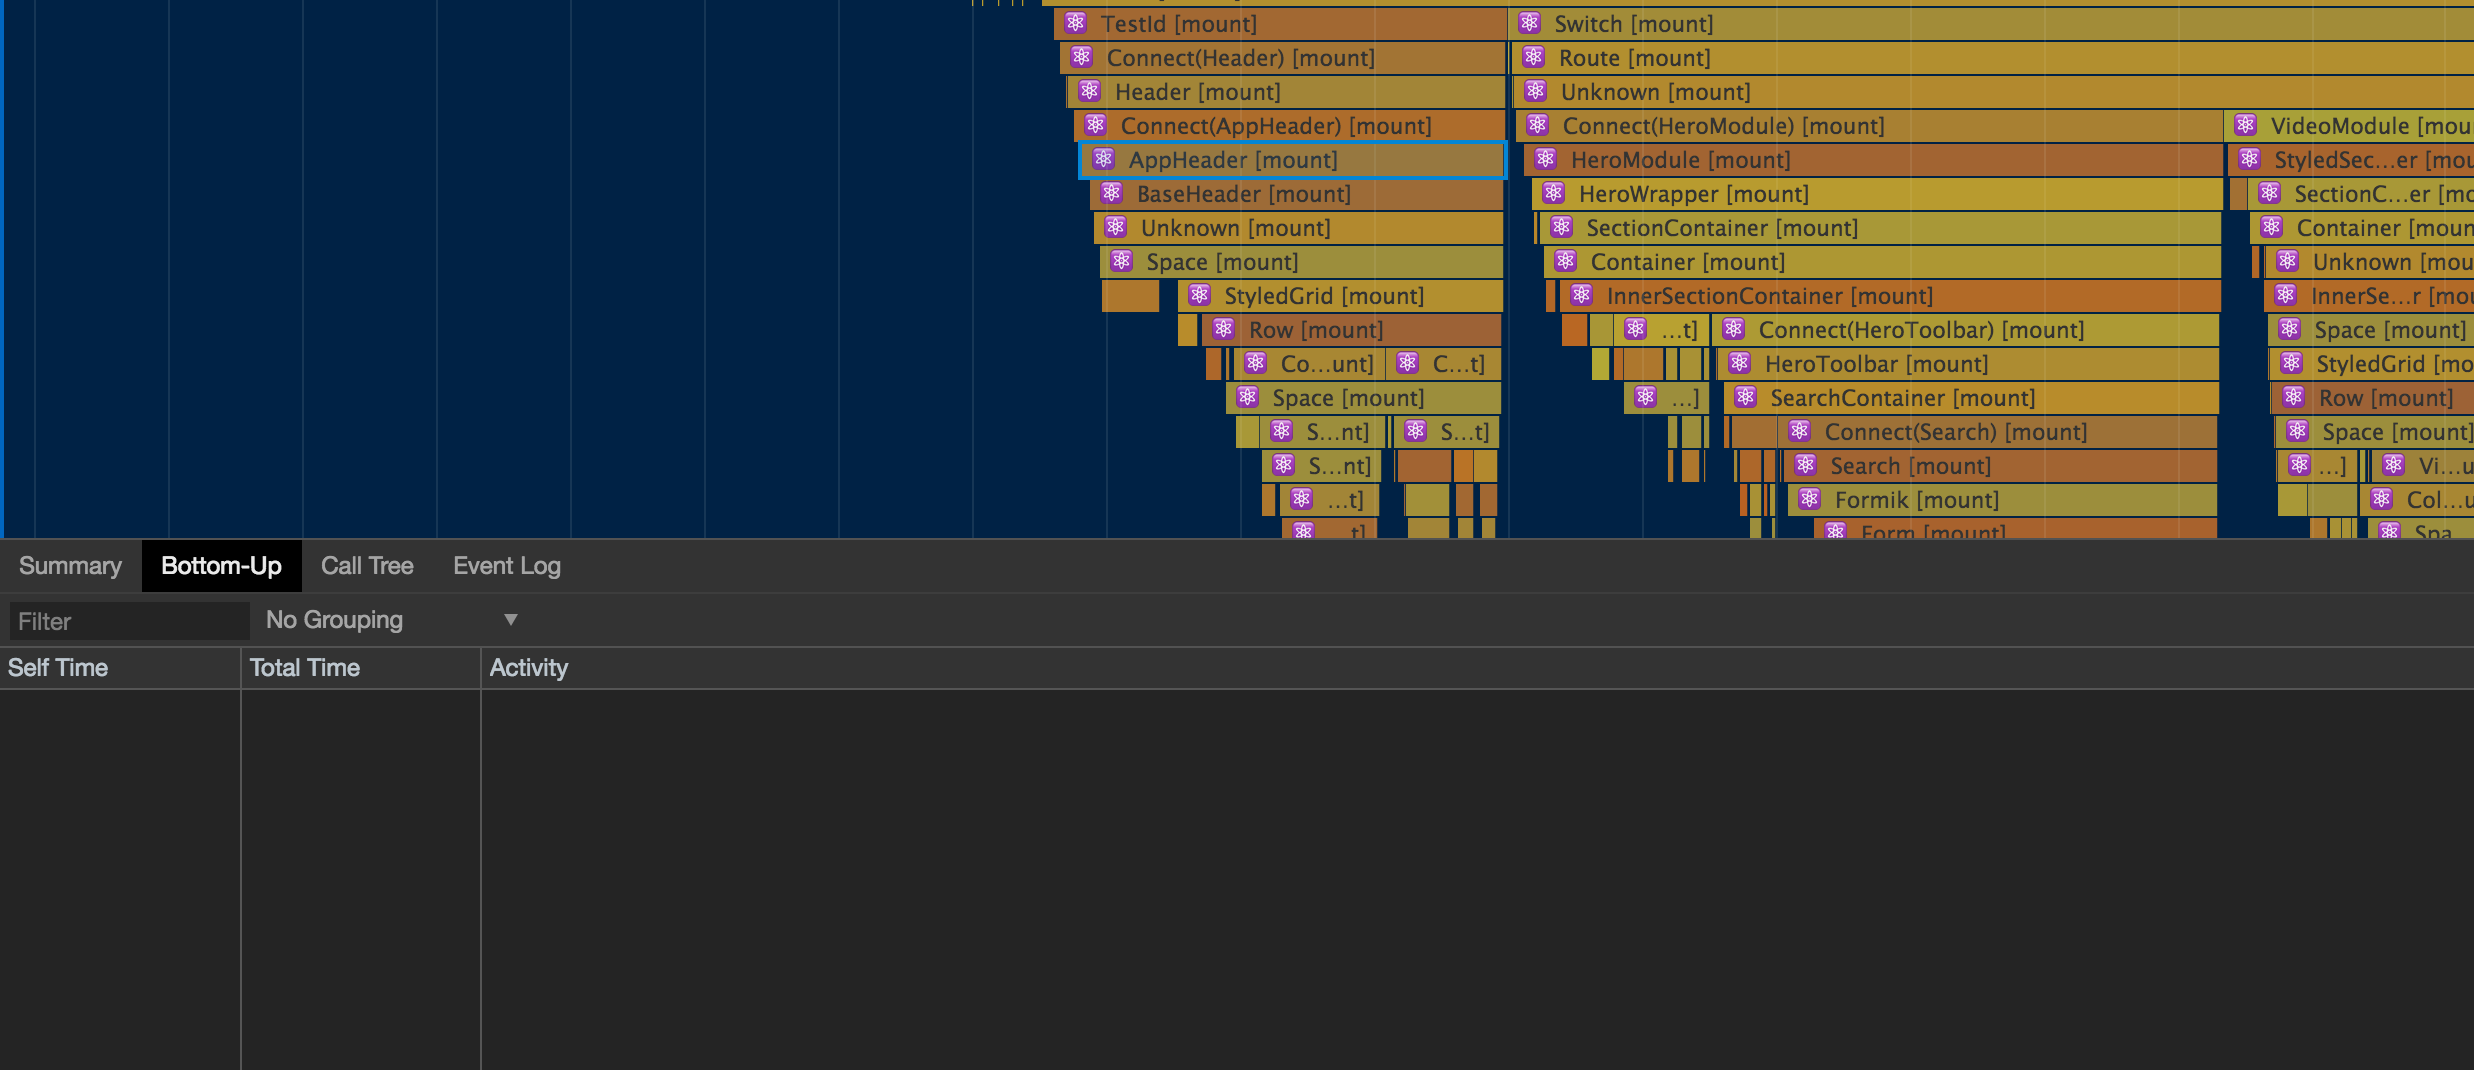
I run the profiling but when I click on the the component, I can't see the exact timing, as is mentioned in the article.
I use React 16, I'm in development mode. I also tried ?react_perf but that didn't help (that should be for React 15 anyway)
Thanks for the answers
Upvotes: 8
Views: 944
Answers (2)

Reputation: 2741
For anyone using React v17 or greater, note these timings have been removed from React: https://github.com/facebook/react/pull/18417.
Upvotes: 3

Reputation: 61
It appears to be an issue with the current stable release of Chrome. Using a newer version of Chrome, such as Chrome Dev or Canary, will allow you to use the breakdown until the update makes its way into a stable release of Chrome.
Sources:
Upvotes: 2
Related Questions
- Listeners in Chrome dev tools' performance profiling results
- How to display exact timing with Chrome Dev Tools?
- Why there is no "User timing" section in my Chrome DevTools
- Significantly higher performance in React whilst profiling with Chrome
- 'Timings' tab in Chrome Performance Profiler Missing
- Chrome performance.timing wrong outputs (NOT MATCHING WITH DEV-TOOLS)
- Stats for child components are not always available in User-Timing section of chrome performance tab
- React Performance Profilng in Chrome
- Analyzing react app performance using chrome
- Chrome - Difference between event time in devtools timeline and performance timing API