
Chuang Men
Reputation: 369
If one tick label is too long, how to constrain the length and let it show in multi-lines?
I'd like to do some plots by matplotlib, but there is a problem that some of my tick labels are too long. I wonder if I can make long tick labels show in multi-lines.
Here is some code:
import numpy as np
import matplotlib.pyplot as plt

data = np.random.random(4)
idx = np.arange(4)

fig = plt.figure()
ax = fig.add_subplot(111)
ax.set_ylim(-0.5, 4-0.5)
ax.set_yticks(b)
ax.tick_params(length=0)
ax.barh(idx, data, zorder=2,
        tick_label=["qwertyuioplkjhgfdsa+1s",
        "abc","asd","qwerty"])
ax.grid(axis='x')

plt.show()
So here is the plot I got.
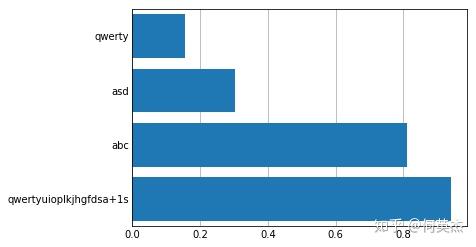
As you can see, the bottom ytick label is too long, and I want to set each line 10 letters at most, so I hope that tick label could be shown in
qwertyuiop
lkjhgfdsa+
1s
or somewhat not so long in one line.
Any help would be appreciated!
Upvotes: 6
Views: 9159
Answers (3)

ImportanceOfBeingErnest
Reputation: 339580
You can use the textwrap module of python. E.g. to wrap at 10 characters:
import textwrap
f = lambda x: textwrap.fill(x.get_text(), 10)
ax.set_yticklabels(map(f, ax.get_yticklabels()))
Upvotes: 5

gmds
Reputation: 19885
You can modify the tick labels right before showing your plot to have a newline every max_chars characters:
max_chars = 10

new_labels = ['\n'.join(label._text[i:i + max_chars ]
                        for i in range(0, len(label._text), max_chars ))
              for label in ax.get_yticklabels()]

ax.set_yticklabels(new_labels)
Upvotes: 2

user69659
Reputation: 199
try adding \n to it
ax.barh(idx, data, zorder=2,
            tick_label=["qwertyuiop \n lkjhgfdsa+ \n 1s",
            "abc","asd","qwerty"])
Upvotes: 2
Related Questions
- Multiple lines of x tick labels
- How to regulate number of ticks plot?
- Make some tick labels larger than others in matplotlib
- How to truncate very long tick labels on y-axis of subplots and fit plot and labels neatly in one fig using matplotlib?
- Change length of one (or however many) ticks
- How to cut long labels in Matplotlib
- How to put variable length tick labels inside the plot canvas in matplotlib?
- Python and plot() : how to limit the number of x-axis ticks (labels)
- How to specify the number of X ticks and their labels in Matplotlib?
- Tick-labels to span over multiple lines