
Reputation: 8841
FFT decibel value not correct
I am studying this post, and there has a example to zero filling 7000 samples to 1000 sample signal!
So I try to write below code to simulate this case but the output not match the post image:
In the post, the expected output image as below:

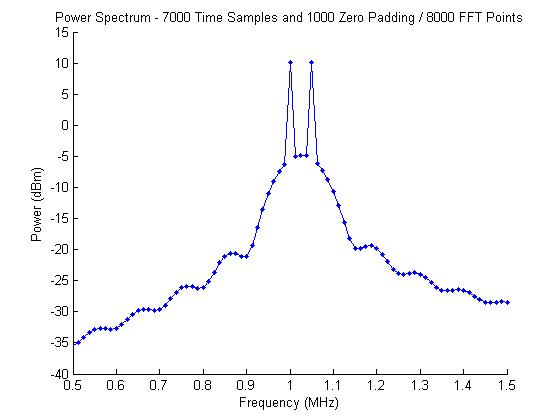
But my output image looks like this:

Obviously:
- The signal decibel information not match (peak -15.96 vs. 11).
- The two peak frequency do not exist on my output.
My full code:
import numpy as np
import pandas as pd
import matplotlib.pyplot as plt
import matplotlib.ticker as ticker
from matplotlib.ticker import FuncFormatter, MultipleLocator
import scipy.fftpack

num = 1000
samplerate = 100*1000000
freq1 = 1*1000000
freq2 = 1.05*1000000
duration = num/samplerate
T = 1.0/samplerate

x = np.arange(0,num,1)*T
y = np.sin(2*np.pi*freq1*x) + np.sin(2*np.pi*freq2*x)
fig,ax = plt.subplots(1,1,figsize=(8,6),constrained_layout=True)

M = 8000
x2 = np.arange(0,duration*8,T)
y2 = np.pad(y, (0, num*7), 'constant')

yfft = np.abs(scipy.fftpack.fft(y2,n=M))[:M//2]
freqs1 = np.fft.fftfreq(M,T)[:M//2]
freqs = np.arange(0, M)[:M//2]*(samplerate/M)
print(freqs[len(freqs)-1])
print(freqs1[len(freqs)-1])
ydb = 20*np.log10(yfft*2/M)

df = pd.DataFrame(list(zip(freqs,ydb)),columns=['freq','value'])
ax.plot(df['freq'],df['value'],marker='.')
print("signal length:%d,frequency length:%d"%(len(y2),len(freqs)))

xmin =   500000
xmax = 1500000
df = df.query('freq > %d and freq < %d'%(xmin,xmax))
ymin = df['value'].min()
ymax = df['value'].max()
ax.set_xlim([xmin,xmax])
ax.set_ylim([ymin,ymax])
ax.set_xticks(np.append(ax.get_xticks(),[xmin,xmax]))
ax.set_yticks(np.append(ax.get_yticks(),[ymin,ymax]))
ax.xaxis.set_major_formatter(FuncFormatter(
    lambda val,pos: '{:.1f}$MHz$'.format(val/1000000)
))
ax.tick_params(axis='x', rotation=45)
ax.grid()
print(freqs[1] - freqs[0])
plt.show()
Upvotes: 1
Views: 111
Answers (1)

Reputation: 8112
In order to see the two peaks, the author of the post states in the title of the figure you posted:
Power spectrum - 7000 Time Samples and 1000 Zero Padding / 8000 FFT points
Your y2 only has 1000 samples of support, with 7000 samples of padding. I did this instead:
# Make the signal: 7000 points.
x = np.arange(0, num*7, 1) * T
y = np.sin(2*np.pi*freq1*x) + np.sin(2*np.pi*freq2*x)

# Pad the signal with 1000 points.
x2 = np.arange(0, num*8, 1) * T
y2 = np.pad(y, (0, num), 'constant')
Now the signal looks right (plotting y2 vs x2):

The power should be 10 dB; I think the multiplier just needs to be updated for this longer signal, for example:
ydb = 20*np.log10(yfft*7/M)
I end up with:

Upvotes: 2
Related Questions
- Unexpected amplitude in numpy fft
- Wrong output for FFT implementation
- Can't generate Numpy FFT properly
- Unexpected FFT Results with Python
- `fft` not returning what it should
- FFT doesn't return correct amplitude
- Numpy fft result is unexpected
- Something wrong with my fft() in python
- (numpy) Wrong amplitude(?) of FFT'd array?
- Wrong decibel result on fft data