Reputation: 51
How to create a R function to normalize data to sum up to 100%
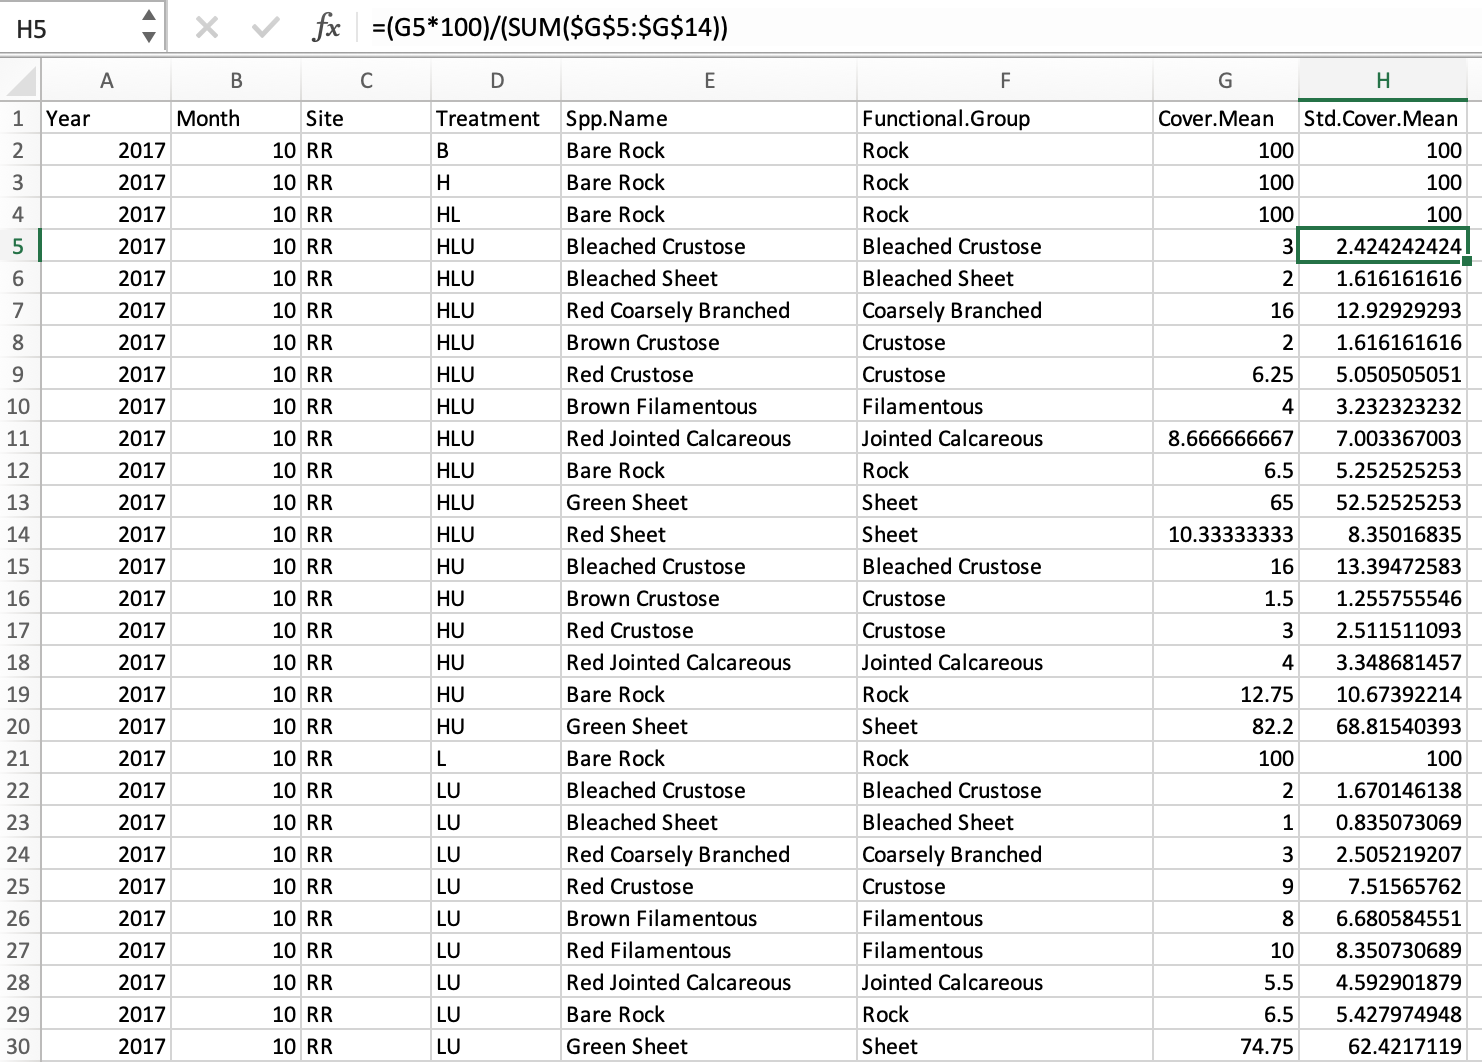
I have average percent cover for each functional group according to Year, Month, Site, and Treatment (see photo). These functional group average values do not sum up to 100% for each treatment group (sorted by year, month, and site). I would like to normalize it to 100%. I was able to create an equation in Excel (as shown in the top of the photo); but it is labor intensive. I am not sure how to create a R function that would automatically do it. I tried to start writing it (below) but I know the sum(x) part is inaccurate. I am not sure how to sum all of the functional group's percent cover for each treatment sorted by site, month and year. Perhaps using the aggregate function would help? Any help would be greatly appreciated!
normalize <- function(x, na.rm = TRUE) x*100/sum(x)

Here's the reproducible example using the dput output.
structure(
 list(
  Year = c(2018L, 2018L, 2018L, 2018L, 2018L, 2018L, 2018L, 2018L, 2018L, 2017L, 2017L, 2018L, 2018L, 2017L, 2018L, 2018L, 2018L, 2018L, 2018L, 2017L, 2018L, 2018L, 2018L, 2018L, 2018L),
  Month = structure(
   c(2L, 1L, 2L, 1L, 3L, 1L, 3L, 3L, 3L, 4L, 5L, 1L, 2L, 5L, 1L, 2L, 1L, 2L, 3L, 5L, 1L, 2L, 3L, 1L, 2L),
   .Label = c("1", "2", "3", "10", "11"),
   class = "factor"
   ),
  Site = structure(
   c(1L, 1L, 1L, 1L, 1L, 1L, 1L, 1L, 1L, 2L, 1L, 1L, 1L, 1L, 2L, 2L, 1L, 1L, 1L, 1L, 2L, 2L, 2L, 1L, 1L),
   .Label = c("RR", "TMB"),
   class = "factor"
   ),
  Treatment = structure(
   c(6L, 7L, 7L, 5L, 5L, 1L, 1L, 4L, 2L, 3L, 4L, 6L, 6L, 6L, 6L, 6L, 7L, 7L, 7L, 7L, 7L, 7L, 7L, 5L, 5L),
   .Label = c("HLU", "U", "HU", "LU", "HL", "B", "H", "L", "P"),
   class = "factor"
   ),
  Spp.Name = structure(
   c(4L, 4L, 4L, 4L, 4L, 4L, 4L, 4L, 4L, 5L, 5L, 6L, 6L, 6L, 6L, 6L, 6L, 6L, 6L, 6L, 6L, 6L, 6L, 6L, 6L),
   .Label = c("Anemones", "Bare Rock", "Barnacles", "Biofilm", "Bleached Coarsely Branched", "Bleached Crustose", "Bleached Jointed Calcareous", "Bleached Sheet", "Brown Coarsely Branched", "Brown Crustose", "Brown Filamentous", "Brown Sheet", "Green Crustose", "Green Filamentous", "Green Sheet", "Mussels", "Red Coarsely Branched", "Red Crustose", "Red Filamentous", "Red Jointed Calcareous", "Red Sheet"),
   class = "factor"
   ),
  Functional.Group = structure(
   c(1L, 1L, 1L, 1L, 1L, 1L, 1L, 1L, 1L, 2L, 2L, 3L, 3L, 3L, 3L, 3L, 3L, 3L, 3L, 3L, 3L, 3L, 3L, 3L, 3L),
   .Label = c("Biofilm", "Bleached Coarsely Branched", "Bleached Crustose", "Bleached Jointed Calcareous", "Bleached Sheet", "Coarsely Branched", "Crustose", "Filamentous", "Invertebrates", "Jointed Calcareous", "Rock", "Sheet"),
   class = "factor"
   ),
  Cover.Mean = c(12, 19, 2, 2, 6.66666666666667, 3, 13, 2, 1, 1, 3, 28, 9, 48.5, 5, 13, 39, 24, 5.66666666666667, 66.25, 6.66666666666667, 7, 4, 57.25, 41.25)
 ),
 row.names = c(NA, 25L),
 class = "data.frame"
)
Upvotes: 1
Views: 1221
Answers (2)

Reputation: 388962
Such operations when you want to perform calculations for every unique value in column are called as grouped operations. There are various functions which would help you achieve what you want.
In base R, you can use ave
df$Std.Cover <- with(df,  Cover.Mean/ave(Cover.Mean, Year, Month, Site, Treatment,
                FUN = sum) * 100)
So here, the first value Cover.Mean in ave is the variable on which we want to apply the function sum but it is done for each Year, Month, Site and Treatment. We divide the sum of each group by Cover.Mean to get ratio and multiply it by 100 to get percentage.
We can also use solutions from different packages like dplyr
library(dplyr)

df %>%
  group_by(Year, Month, Site, Treatment) %>%
  mutate(Std.Cover = Cover.Mean/sum(Cover.Mean) * 100)
Or data.table
library(data.table)
setDT(df)[, Std.Cover := Cover.Mean/sum(Cover.Mean) * 100,
                        .(Year, Month, Site, Treatment)]
Upvotes: 2

Reputation: 843
Assigning your reproducible example to the df variable, you should be able to do what you are trying to do this way:
for (i in 1:nrow(df)) {
  df$Std.Cover.Mean[i] <- df$Cover.Mean[i] * 100 / sum(
    df$Cover.Mean[
      which(
        df$Year == df$Year[i] & df$Month == df$Month[i] & df$Site == df$Site[i] & df$Treatment == df$Treatment[i]
        )
      ]
    )
  }
Essentially, the sum function adds up all the Cover.Mean values where Year, Month, Site, and Treatment are the same as those of the row in question.
Upvotes: 0
Related Questions
- How to use apply function from R to normalize data frame?
- R - Normalize values (based on some of the values)
- Normalization with apply
- Normalize variables from 0 to 1 with different range of variables?
- Normalise the columns of a dataframe (sum equal to 1)
- How can I normalize each column value by the sum of its column with data.table library?
- Scale percentage data to mean of 50%
- Rescale Values in percentage in R
- Normalizing data in R
- how can I normalize data frame values by the sum (get percents)