Reputation: 105
Is it possible to get shadding/pattern in google chart?
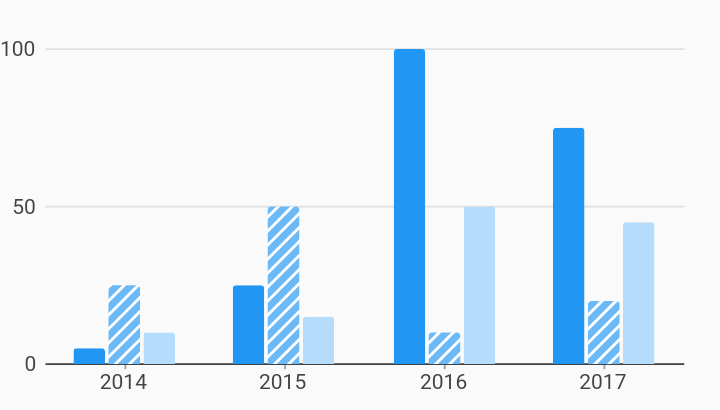
Is it possible to get the shadded pattern or similar pattern as below middle bar while using google bar (and stacked-bar) chart ?

Upvotes: 0
Views: 2590
Answers (2)
Reputation: 105
Set Roles for certainity as :-
this.myRoles.push({ role: 'certainty', type: 'boolean', index: i });
and setting the value to false did the trick.
But i am not able to change the pattern off shading. Would appreciate any help i could get with that.
Upvotes: 0

Reputation: 61230
as you found, certainty is the only possibility out of the box.
however, we can use custom svg patterns, or even gradients, by manually changing the chart,
using a mutation observer.
we need the mutation observer because the chart will revert back to the original color option,
on any interactivity, such as hovering or clicking the bar.
first, add your pattern definition to the html somewhere.
this element should not be hidden with display: none,
otherwise, some browsers may ignore it.
setting the size to zero pixels seems to work.
<svg style="width:0;height:0;position:absolute;" aria-hidden="true" focusable="false">
  <pattern id="pattern-fill" x="0" y="0" width="8" height="8" patternUnits="userSpaceOnUse" patternTransform="rotate(30)">
     <rect x="0" y="0" width="4" height="8" style="stroke: none; fill: #29B6F6;" />
  </pattern>
</svg>
next, we need to be able to identify the elements that make up the bars we want to change.
here, we'll use a specific color in the options.
then we find the elements with the default color, and change the fill attribute.
see following working snippet...
google.charts.load('current', {
  packages:['corechart']
}).then(function () {
  var dataTable = new google.visualization.DataTable({
    cols: [
      {label: 'x', type: 'string'},
      {label: 'y0', type: 'number'},
      {label: 'y1', type: 'number'},
      {label: 'y2', type: 'number'}
    ],
    rows: [
      {c:[{v: '2014'}, {v: 8}, {v: 20}, {v: 12}]},
      {c:[{v: '2015'}, {v: 20}, {v: 50}, {v: 15}]},
      {c:[{v: '2016'}, {v: 100}, {v: 12}, {v: 50}]},
      {c:[{v: '2017'}, {v: 75}, {v: 18}, {v: 45}]}
    ]
  });

  var chartOptions = {
    height: 600,
    colors: ['#0288d1', '#29b6f6', '#b3e5fc']
  };

  var container = document.getElementById("chart_div");
  var chart = new google.visualization.ColumnChart(container);

  google.visualization.events.addListener(chart, 'ready', function () {
    var observer = new MutationObserver(function () {
      container.getElementsByTagName('svg')[0].setAttribute('xmlns', 'http://www.w3.org/2000/svg');
      Array.prototype.forEach.call(container.getElementsByTagName('rect'), function(rect) {
        if (rect.getAttribute('fill') === '#29b6f6') {
          rect.setAttribute('fill', 'url(#pattern-fill) #29b6f6');
        }
      });
    });
    observer.observe(container, {
      childList: true,
      subtree: true
    });
  });

  chart.draw(dataTable, chartOptions);
});
<script src="https://www.gstatic.com/charts/loader.js"></script>
<div id="chart_div"></div>
<svg style="width:0;height:0;position:absolute;" aria-hidden="true" focusable="false">
<pattern id="pattern-fill" x="0" y="0" width="8" height="8" patternUnits="userSpaceOnUse" patternTransform="rotate(30)">
<rect x="0" y="0" width="4" height="8" style="stroke: none; fill: #29B6F6;" />
</pattern>
</svg>Upvotes: 3
Related Questions
- Google Chart Background Color
- Drawing visual Lines in Google Charts
- How to set the formatting on the axes in Google Charts to a certain pattern?
- Google Charts - Change bar color
- Google charts different colors w/ single series Material bar chart
- Is this possible in google charts or is there an alternitive or hack
- Add noise to chart (Google charts api)
- Google Chart Customization
- different symbols in a google charts scatter plot
- How to create Google Chart with lines (series) of different lengths?