
Reputation: 63
Metrics like response time of an API in spring cloud gateway
I am using Spring Cloud Gateway and would want to capture the metrics for all API hits. Metrics include response time, error codes, etc. I am using Hoxton.RELEASE version of Spring cloud. I tried using /actuator/metrics/gateway.requests as suggested in their documentation but it didn't work. Also , it will be better if these metrics would be available through jmx metrics. I tried using jmx as well and visualized it on jconsole but it wasn't showing the response time ,etc for an API.
Could someone suggest how to do it? We have to use it in production and this is an important factor for us.
Upvotes: 1
Views: 7902
Answers (4)

Reputation: 21
You have to add metrics in server.management.endpoints.web.exposure.include
server:
  spring:
    cloud:
      gateway:
        metrics:
          enabled: true
          tags:
            path:
              enabled: true
    management:
      endpoints:
        web:
          exposure:
            include: health,metrics
Upvotes: 2

Reputation: 31
After checking '/actuator/metrics' Its metrics now is '/actuator/metrics/spring.cloud.gateway.requests' on "spring-cloud-starter-gateway".

Upvotes: 1

Reputation: 81
I faced the same issue that's really headache. The endpoint is not working:
/actuator/metrics/gateway.requests
I finally figure out that if you don't have data (requests, responses) that endpoint will not work, it will show error when you check it with your browser (it's really not preferable and make everyone confuse, like you and me)
I have to make script to curl the gateway in order to generate the requests so then the endpoint can have data to work
Also in the application. properties you have to make sure these configured
management.endpoint.gateway.enabled=true # default value

management.endpoints.web.exposure.include=gateway
Reference link: https://cloud.spring.io/spring-cloud-static/spring-cloud-gateway/2.2.0.RC1/reference/html/#actuator-api
Another interesting thing is about the graphical dashboard that Spring supports for Grafana, you can use this json definition from Spring and import it into your Grafana.
The dashboard will look like this:
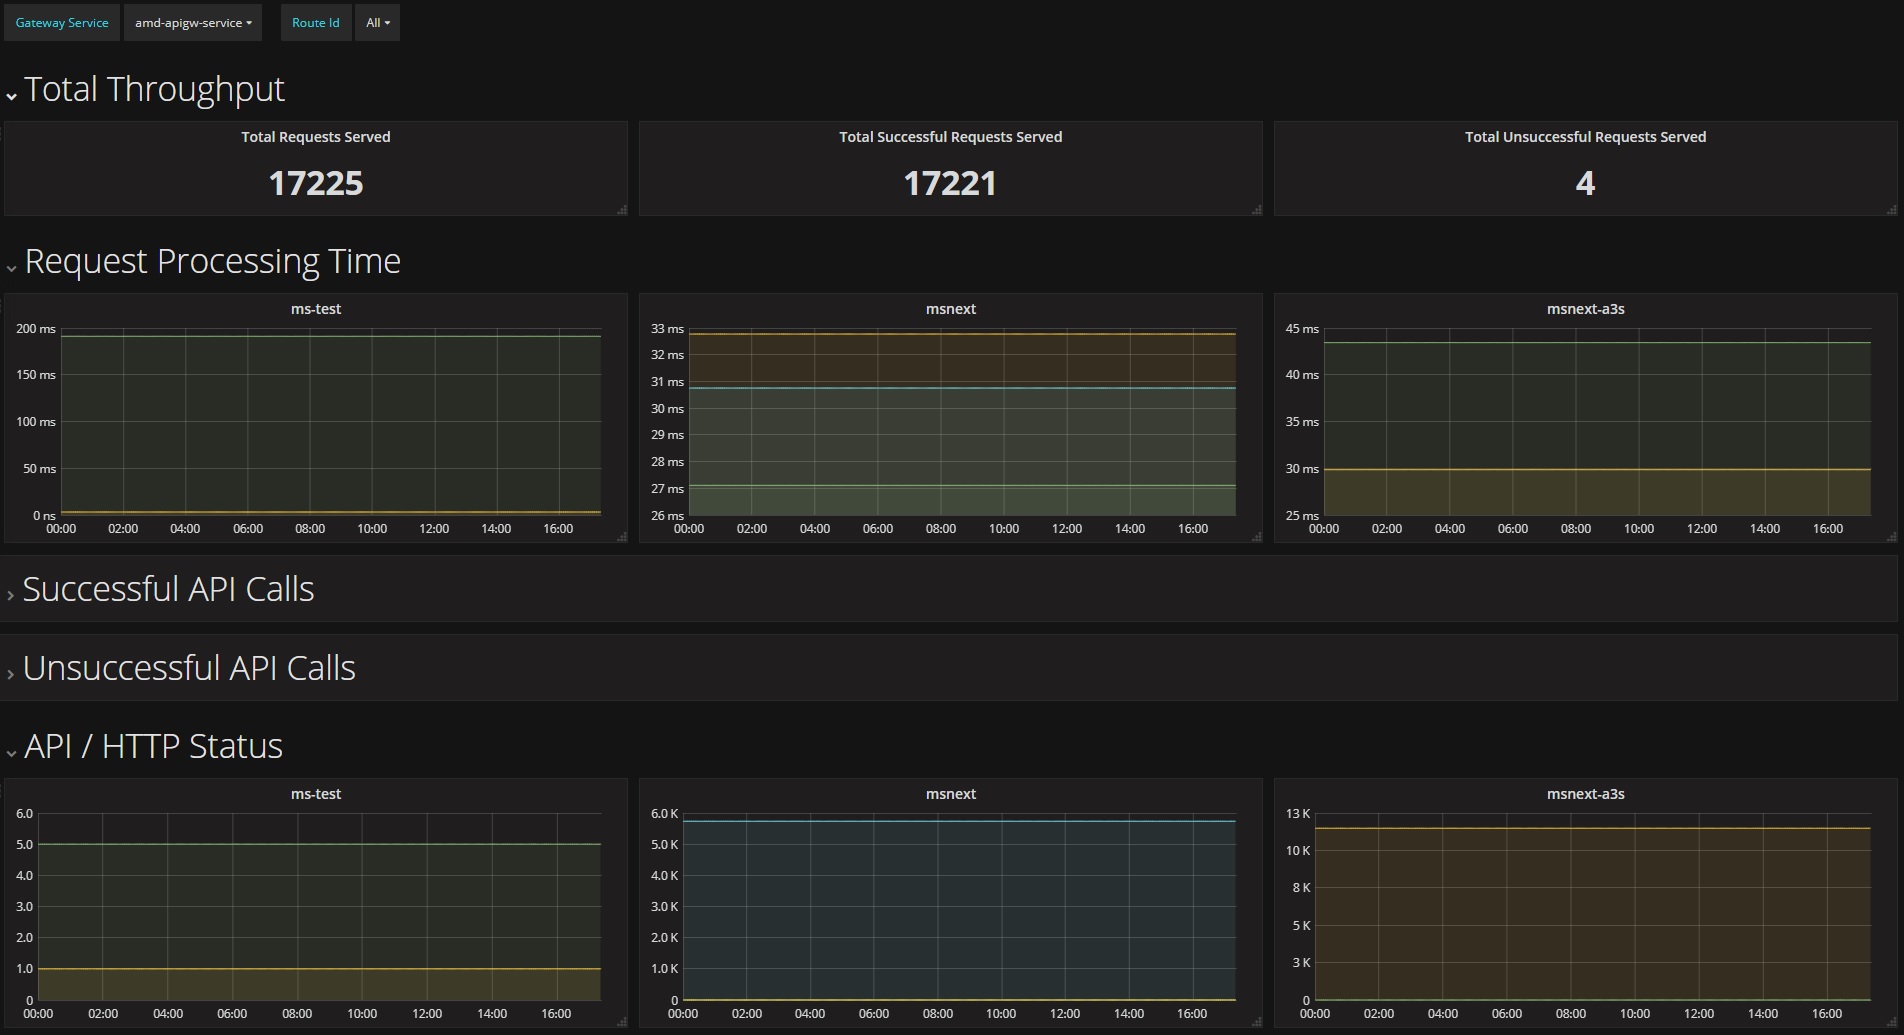
Reference link: https://cloud.spring.io/spring-cloud-static/spring-cloud-gateway/2.2.1.RELEASE/reference/html/#the-gateway-metrics-filter
Btw, the above GatewayFilter can work out too but that will add another layer to your filter-chain and it might create little overhead for your gateway, if you have the high load, you need to consider this cause it might downgrade your application
Regarding the JMX, you can reference here Spring official document: https://docs.spring.io/spring-boot/docs/current/reference/html/actuator.html#actuator.endpoints.exposing
Most of the endpoint supports JMX, including Spring Gateway
Upvotes: 2

Reputation: 2198
You can capture the response time of all the API hits to spring cloud gateway by writing a custom filter factory like below:
    ResponseFilterFactory extends AbstractGatewayFilterFactory<ResponseFilterFactory.Config> {

    public ResponseFilterFactory() {
            super(Config.class);
        }

       @Override
public GatewayFilter apply(Config config) {
return new OrderedGatewayFilter((exchange, chain) -> {
// Pre-processing
startTime = System.currentTimeMillis();

    return chain.filter(exchange)
      .then(Mono.fromRunnable(() -> {
          // Post-processing
             String serviceResponseStatus= exchange.getResponse().getStatusCode().toString();

                if(serviceResponseStatus.startsWith("2")){
                    serviceResponseStatus="Success";
                }
                else{
                    serviceResponseStatus="Failure";
                }
            long execTime = System.currentTimeMillis() - startTime;
            LOGGER.info("caller={}, serviceName={}, serviceResponseStatus={}, serviceResponseTime(ms)={}", Objects.isNull(caller) ? "default" : caller,
                    serviceName, serviceResponseStatus, execTime);

      }));
},1);
}


        public static class Config {
                private String headerName;

                public String getHeaderName() {
    // add some thing to config if you want to log along with resp time, ex. headers etc
                       return null;
                }
        }
After this you can add this in your routing config file as a default filter:
  cloud:
    gateway:
      default-filters:
      - name: ResponseFilterFactory
Upvotes: 0
Related Questions
- How to measure request time in Spring Boot including status 404?
- How to get response time for SpringBoot REST API services?
- How to measure response times of API calls?
- Measure Spring RestTemplate HTTP request time
- Measure response time for an API
- How to get metrics of outgoing http calls in Spring Boot?
- Request response latency time for int-http:outbound-gateway
- Counter Metrics for Rest Api's in SpringBoot
- Spring integration + logging response time for http adapters(or any endpoint)
- JMeter report metrics of each request