Reputation: 351
Plot smoothing matplotlib and seaborn
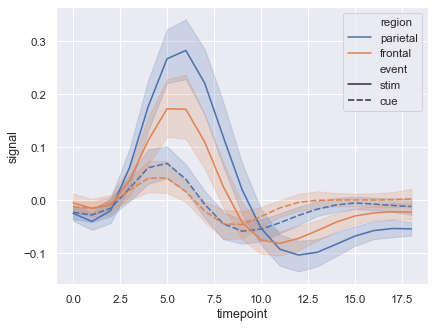
I am trying to display my data in a nice way such as seen on the seaborn documentation:

I am not too sure how to proceed. I managed to get the values of points and their respective standard deviation but it looks scattered while I just want to show a tendency:

I look into here, and there trying to apply the proposed solution but I couldn't make it work.
Here is what I play with:
Final_array =         Mean       Std
0   0.739269  0.157892
1   0.807382  0.160464
2   0.800024  0.137239
3   0.825854  0.132472
4   0.864854  0.070544
..       ...       ...
95  0.797202  0.101961
96  0.747578  0.143394
97  0.751472  0.158651
98  0.587009  0.198987
99  0.728447  0.104601

sns.set(style="darkgrid", palette="muted", color_codes=True)
fig, ax = plt.subplots(figsize=(7,5))
y_pos = np.arange(Final_array.shape[0])
ax.errorbar(y_pos, Final_array[:,0], yerr=Final_array[:,1], elinewidth=0.5)
plt.show()
Does anyone have an idea? I am very beginner in using plots. Would it be possible to smooth? and get the nice overlay as in the seaborn image instead of the error bars?
These might be silly questions.
Kind regards,
Upvotes: 3
Views: 29276
Answers (2)
Reputation: 351
Thank you for your help! I managed to generate the graph that I wanted!
First, the spline wouldn't work because my data is not sorted. Hence, I used gaussian_filter1d proposed by @JohanC and found here as well. However, apparently it can alter the data (read comment on here) so I decided to plot both of the graph together:
Using this final version:
import numpy as np
import matplotlib.pyplot as plt
import seaborn as sns
from scipy.ndimage.filters import gaussian_filter1d

Final_array =         Mean       Std
0   0.739269  0.157892
1   0.807382  0.160464
2   0.800024  0.137239
3   0.825854  0.132472
4   0.864854  0.070544
..       ...       ...
95  0.797202  0.101961
96  0.747578  0.143394
97  0.751472  0.158651
98  0.587009  0.198987
99  0.728447  0.104601

sns.set(style="darkgrid", palette="muted", color_codes=True)
fig, ax = plt.subplots(figsize=(7,5))
y_pos = np.arange(Final_array.shape[0])

# Smoothing
Final_array_smooth = gaussian_filter1d(Final_array[:,0], sigma=2)

# Error formating
upper_err = gaussian_filter1d(Final_array[:,0] + (Final_array[:,1]/2), sigma=5)
lower_err = gaussian_filter1d(Final_array[:,0] - (Final_array[:,1]/2), sigma=5)

ax.plot(y_pos, Final_array[:,0], '--', linewidth=0.7, color='k', alpha=0.45)
ax.plot(y_pos, Final_array_smooth)
ax.fill_between(y_pos, upper_err, lower_err, color='crimson', alpha=0.2)

ax.set_ylim(np.min(Final_array[:,0])-(np.min((Final_array[:,0])*20)/100), np.max(Final_array[:,0])+(np.max((Final_array[:,0])*10)/100))
plt.show()
Thank you very much !
Upvotes: 3

Reputation: 80409
You can use fillbetween for smoothed upper and lower curves. Choosing a higher sigma would give more smoothness.
Here is some example code:
import matplotlib.pyplot as plt
import numpy as np
from scipy.ndimage.filters import gaussian_filter1d

x = np.linspace(0, 100, 100)
y = 0.95 - ((50 - x) / 200) ** 2
err = (1 - y) / 2
y += np.random.normal(0, err / 10, y.size)

upper = gaussian_filter1d(y + err, sigma=3)
lower = gaussian_filter1d(y - err, sigma=3)

fig, ax = plt.subplots(ncols=2)

ax[0].errorbar(x, y, err, color='dodgerblue')

ax[1].plot(x, y, color='dodgerblue')
ax[1].fill_between(x, upper, lower, color='crimson', alpha=0.2)

plt.show()
Upvotes: 6
Related Questions
- Stop seaborn changing matplotlib plot style
- How to interpolate points in seaborn
- How to make this matplotlib plot less noisy?
- python, smoothing 2d plot ? , trend line?
- How can smooth heatmap plots easily in Seaborn?
- Modified Bland–Altman plot in Seaborn
- How do I plot this using seaborn?
- Patches in seaborn
- inconsistent plot between matplotlib and seaborn in Python
- How can I make my plot smoother in Python?

