
Reputation: 428
How to convert from frequency domain to time domain in python
I know this is basic for signal processing, but, I am not sure what is wrong about my approach. I have a signal that behaves as damped sine signal with a sampling frequency of 5076Hz and 15,000 number of samples. I found from the following website how to convert a signal from a time domain to frequency domain and managed to get the FFT and frequency values. The code can be found below the link:
Machine Learning with Signal Processing Techniques
def get_fft_values(y_values, T_s, N, f_s):
    f_values = np.linspace(0.0, 1.0/(2.0*T), N//2)
    fft_values_ = np.fft.rfft(y_values)
    fft_values = 2.0/N * np.abs(fft_values_[0:N//2])
    return f_values, fft_values
I managed to get the frequency and FFT values. However, I need to implement filters to remove some noise from the signal, so, I created the following functions to implement the filter part:
def butter_bandpass(lowcut, highcut, fs, order):
    nyq = 0.5 * fs
    low = lowcut / nyq
    high = highcut / nyq
    b, a = butter(order, [low, high], btype='bandpass', output='ba')
    return b, a

def butter_bandpass_filter(data, lowcut, highcut, fs, order):
    b, a = butter_bandpass(lowcut, highcut, fs, order=order)
    y = filtfilt(b=b, a=a, x=data)
    # y = lfilter(b=b, a=a, x=data)
    return y
I know that I would need to implement the following steps:
- Convert to the frequency domain
- apply a bandpass filter to get rid of frequencies you don't care about
- convert back to the time domain by inverse Fourier transform
So, I created the following inverse transform function, but, I can't get the filtered signal back and the amplitudes don't almost match the original signal. (For my case, I need to resample)
def get_ifft_values(fft_values, T, N, f_s):
    # Time axis:
    N = 9903
    S_T = 1 / S_F
    t_n = S_T * N  # seconds of sampling
    # Obtaining data in order to plot the graph:
    x_time = np.linspace(0, t_n, N)
    ifft_val = np.fft.irfft(fft_values, n=N)
    y_s, x_time = scipy.signal.resample(x=ifft_val, num=N, t=x_time)
    return x_time, y_s
What am I doing wrong here?
Edit 1:
Based on the answer from @Han-Kwang Nienhuys. I edited the above code and applied it to the approach below:
##### Converting the signal into fft:
f_val, fft_val = get_fft_values(y_values=y, T=S_T, N=N, f_s=S_F)
# Applying bandpass filter:
fft_filt_val = butter_bandpass_filter(data=fft_val, lowcut=50, highcut=600, fs=S_F, order=2)
# Applying the inverse transform of the frequency domain:
x_time, y = get_ifft_values(fft_values=fft_filt_val, T=S_T, N=N, f_s=S_F)
Here are the results from the signal:
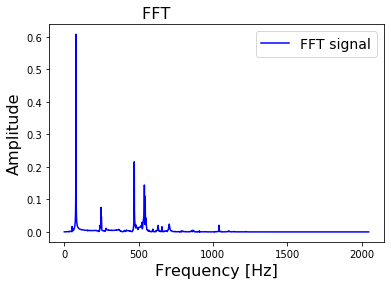
- FFT of the original signal:
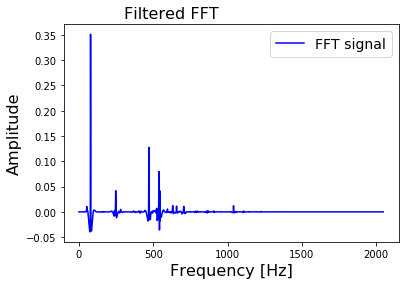
- Filtered FFT of the original signal:
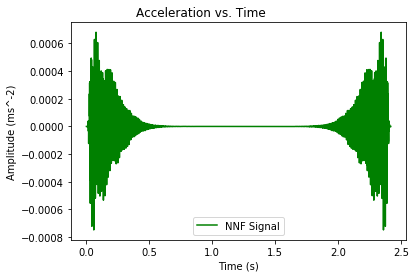
- Converted Signal from Filtered FFT:
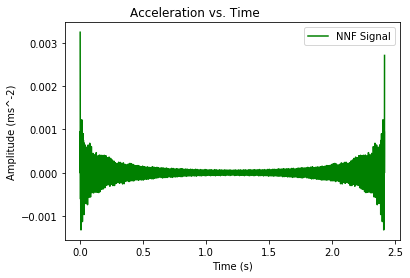
- Without Applying the bandpass filter:
Upvotes: 0
Views: 14212
Answers (1)

Reputation: 3264
There are several issues:
- You are using
np.fft.fft, which is a complex-valued discrete Fourier transform, containing frequencies up to twice the Nyqvist frequency. The frequencies above the Nyqvist frequency can be interpreted equivalently as negative frequencies. You are indeed using a frequency slice[:N//2], but if you want the inverse transform to work, you also need to deal with the other half of the spectrum. - Don't take the absolute values of the FFT data. The filter must operate on the complex-valued coefficients.
- If you use
scipy.signal.filtfilt: that function operates on time-domain data, not on frequency-domain data.
For real-valued input data, it's much easier to use a real-valued FFT, which will behave more like you expect:
n = len(y)
yf = np.fft.rfft(y)
fstep = f_sampling / n
freqs = np.arange(len(yf)) * fstep
To transform back, use np.fft.irfft.
Upvotes: 0
Related Questions
- Fourier Transform Time Series in Python
- Signal processing with Fourier transform
- Fourier Transformation in Python
- FFT on time domain
- Plotting FFT frequencies in Hz in Python
- Do Fourier Transformation using Python
- How to convert signal from Time domain to Frequency domain with Java
- How to apply filter in time-domain signal in Python
- How to get time/freq from FFT in Python
- Fast Fourier Transform (fft) with Time Associated Data Python