Thanos
Reputation: 386
Octave: Problems with adding two datas together to create a new stem graph
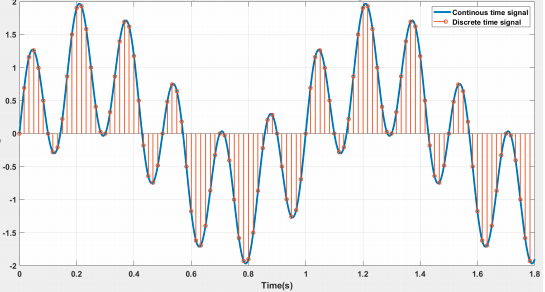
Apologies if my title is vague but I created a sine wave combined from 2 previous sampling wave graphs (Nyquist frequencies). I also tried to create a stem graph with the intent of the output looking like the sine wave was getting discretely sampled, looking like this:

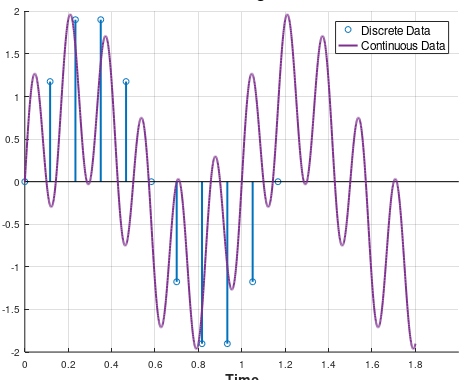
I did manage to successfully get the wave, but as for the rest of it ended up looking like this:

This is my code:
%Time Base
t = 0:0.001:1.8;

%Nyquist Frequencies
Fn1 = 1;
Fn2 = 6;

%Nyquist Rates
Fnr1 = 2*(Fn1);
Fnr2 = 2*(Fn2);

%Sampling Period
Sp1 = 5*(Fnr1);
Sp2 = 5*(Fnr2);

Ts1 = 1/(Sp1);
Ts2 = 1/(Sp2);
T1 = 1/(Fn1);
T2 = 1/(Fn2);

%Number of Samples
N1 = (T1/Ts1);
n1 = 0:1:N1;
N2 = (T2/Ts2);
n2 = 0:1:N2;

nTs1 = n1 * Ts1;
nTs2 = n2 * Ts2;
x_c = sin(2*pi*Fn1*nTs1);
x_c1 = sin(2*pi*Fn1*t);

x_c2 = sin(2*pi*Fn2*nTs2);
x_2 = sin(2*pi*Fn2*t);

signal = x_c1 + x_2;
ct = nTs1 + nTs2;
nqsignal = x_c + x_c2;

%Second Part
h = stem(ct, nqsignal, 'linewidth', 2);
hold
plot(t, signal, 'linewidth', 2)
lgd = legend('Discrete Data', 'Continuous Data');
set (lgd, "fontsize", 12)
set(gca,'XTick',[0:0.2:1.8]);
set(gca,'YTick',[-2:0.5:2]);
title('Time vs Magnitude','fontweight','bold','fontsize',16);
xlabel('Time','fontweight','bold','fontsize',14)
ylabel('Magnitude','fontweight','bold','fontsize',14)
grid
I thought that, like the sine wave, I could just simply add the values to create the variable "nqsignal", unfortunately not working and making those inaccurate outputs.
Upvotes: 1
Views: 230
Answers (0)
Related Questions
- GNU octave graph
- Error using stem (line 43) X must be same length as Y
- Octave one line two plot differ from multiple line plot
- Octave problem with ploting only some samples of audiosignal
- Octave line plot doesn't follow data points
- Failed to plot simple graph in Octave
- Failed to plot graph of two arrays in Octave
- stem: inconsistent size of x and y
- MATLAB - Plot half the Nyquist Plot
- Plot two graphs with different times on one graph