
Reputation: 9176
Finding the convolution of two histograms
The probability distribution of the sum of two random variables, x and y, is given by the convolution of the individual distributions. I'm having some trouble doing this numerically. In the following example, x and y are uniformly distributed, with their respective distributions approximated as histograms. My reasoning says that the histograms should be convoluted to give the distribution of, x+y.
from numpy.random import uniform
from numpy import ceil,convolve,histogram,sqrt
from pylab import hist,plot,show

n = 10**2

x,y = uniform(-0.5,0.5,n),uniform(-0.5,0.5,n)

bins = ceil(sqrt(n))

pdf_x = histogram(x,bins=bins,normed=True)
pdf_y = histogram(y,bins=bins,normed=True)

s = convolve(pdf_x[0],pdf_y[0])

plot(s)
show()
which gives the following,
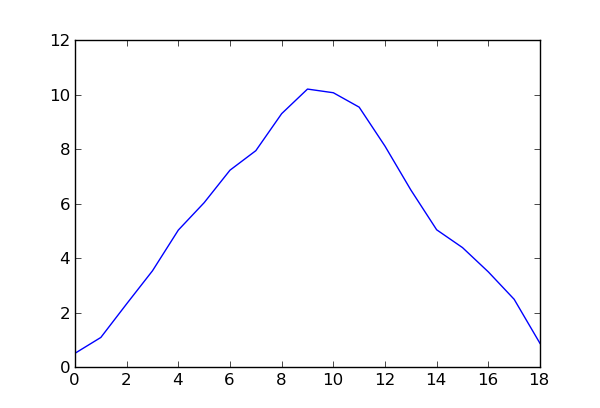
In other words, a triangular distribution, as expected. However, I have no idea how to find the x-values. I would appreciate it if someone could correct me here.
Upvotes: 2
Views: 5427
Answers (1)

Reputation: 7530
In order to still move on (towards more murky details), I further adapted your code like this:
from numpy.random import uniform
from numpy import convolve, cumsum, histogram, linspace

s, e, n= -0.5, 0.5, 1e3
x, y, bins= uniform(s, e, n), uniform(s, e, n), linspace(s, e, n** .75)
pdf_x= histogram(x, normed= True, bins= bins)[0]
pdf_y= histogram(y, normed= True, bins= bins)[0]
c= convolve(pdf_x, pdf_y); c= c/ c.sum()
bins= linspace(2* s, 2* e, len(c))
# a simulation
xpy= uniform(s, e, 10* n)+ uniform(s, e, 10* n)
c2= histogram(xpy, normed= True, bins= bins)[0]; c2= c2/ c2.sum()

from pylab import grid, plot, show, subplot
subplot(211), plot(bins, c)
plot(linspace(xpy.min(), xpy.max(), len(c2)), c2, 'r'), grid(True)
subplot(212), plot(bins, cumsum(c)), grid(True), show()
Thus, giving plots something like this:
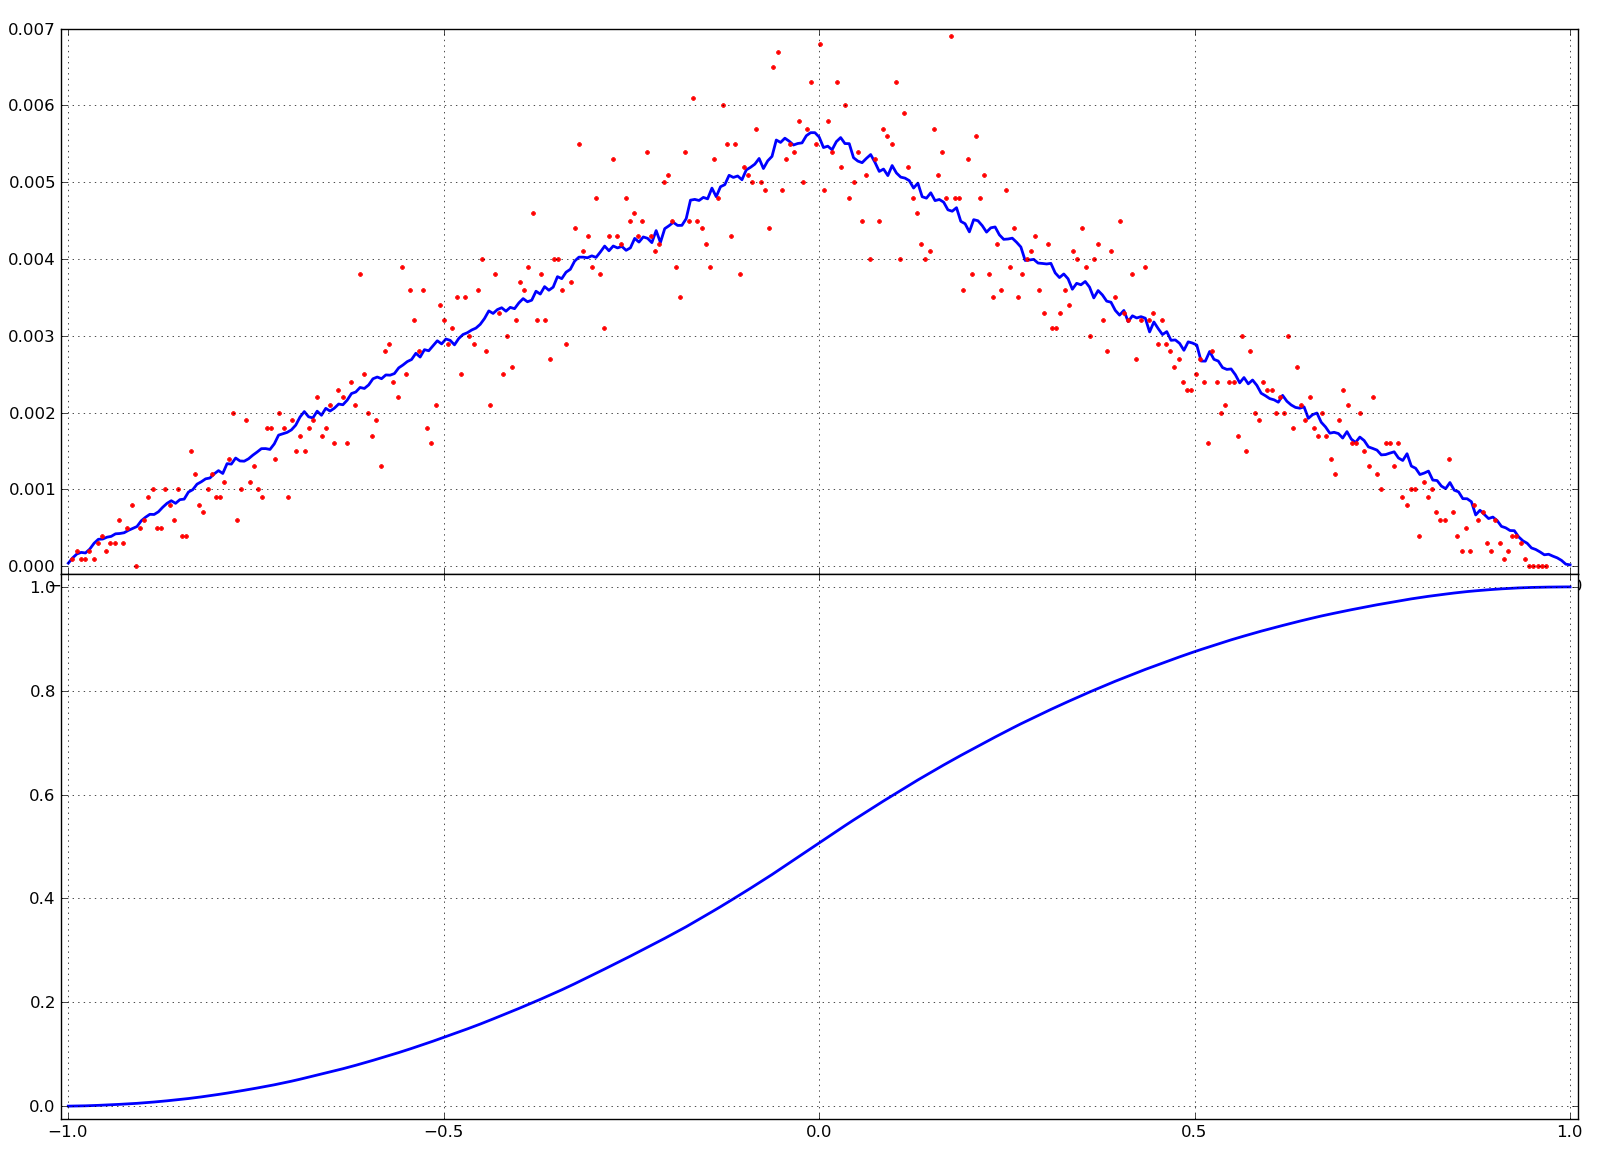 Where the upper part represents the
 PDF (blue line), which indeed looks quite triangular and the simulation (red dots), which reflects the triangular shape. Lower part represents the CDF, which also looks to follow nicely the expected S-curve.
Upvotes: 5
Related Questions
- Histogram from two coupled arrays
- Convolution of more than 2 probability distributions in Python
- probability density function from histogram in python to fit another histrogram
- Python: How to get the convolution of two continuous distributions?
- How to combine two histograms python
- Probability functions convolution in python
- Convolution of two pdf
- How to convolve two distirbutions from scipy library
- taking the average of two histograms in python
- Probability distribution function in Python