
Reputation: 942
Order variables geom_point based on similar pattern across x-axis in R
How could I order the variables so they are plotted such as a heat map/where they show similar pattern, ie: at the top A and D, then B, C, and bottom E. Would want to avoid doing it manually as real data is many more variables.
Variable1 <- c(rep("A",7), rep("B",7),rep("C",7), rep("D",7), rep("E",7))
Variable2 <- c(rep(1:7, 5))
value <- c(15, 16, 11, 12, 13, 11, 12, 4, 3, 6, 5, 4, 3, 2, 3, 3, 2, 3, 3, 4, 3, 18, 17, 15, 2, 3, 4, 5, 2, 3, 4, 5, 6, 10, 18)
dff <- data.frame(Variable1, Variable2, value)

library(dplyr)
dff <- dff %>%group_by(Variable1)%>%
  mutate(scaled_val = scale(value)) %>%
  ungroup()

dff$Variable <- factor(dff$Variable1,levels=rev(unique(dff$Variable1)))

ggplot(dff, aes(x = Variable2, y = Variable1, label=NA)) +
  geom_point(aes(size = scaled_val, colour = value)) +
  geom_point(aes(size = scaled_val, colour = value), shape=21, colour="black") +
  geom_text(hjust = 1, size = 2) +
  theme_bw()+
  scale_color_gradient(low = "lightblue", high = "darkblue")+
  scale_x_discrete(expand=c(1,0))+
  coord_fixed(ratio=4)

And desired:

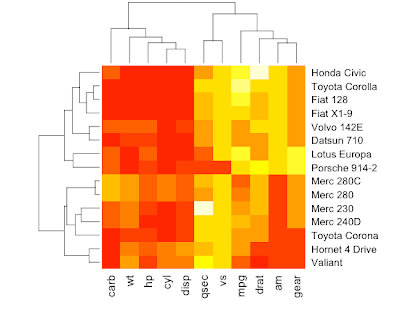
If you look at a heat map with clustered rows by similarity for example: https://3.bp.blogspot.com/-AI2dxe95VHk/TgTJtEkoBgI/AAAAAAAAC5w/XCyBw3qViGA/s400/heatmap_cluster2.png you see at the top you have the row whose pattern are first x-axis timepoints, then the ones higher at the last x-axis timepoints..
To do: So I wonder if using the scaled value, we can do so the top are the ones with higher mean in Variable2 (1:2), then higher mean Variable2 (3:5) then Variable2 (6:7). Let me know if I am not being clear here and can explain, better.
Upvotes: 0
Views: 106
Answers (1)

Reputation: 2253
It sounds like you want to arrange groups A-E based on their mean. You can do that by converting Variable1 into a factor with custom levels:
lvls <- names(sort(by(dff$value, dff$Variable1, mean)))
dff$Variable1 <- factor(dff$Variable1, levels = lvls)
Here's a solution that sorts groups by which.max:
peaks <- c(by(dff$value, dff$Variable1, which.max))
lvls <- names(sort(peaks))
dff$Variable1 <- factor(dff$Variable1, levels = lvls)

Upvotes: 2
Related Questions
- R: Sort points in ggplot
- Order X axis in ggplot, when there are multiple geoms with different factors
- Is there a geom for the ordering of points within a variable?
- Display `dplyr` groups ordered by their corresponding value (not name) in `geom_point`
- geom_line with x-axis in order of appearance
- How to arrange the order of geom points in ggplot?
- ggplot2: order bivariate points in geom_point() based on a third variable?
- Ordering in geom_dotplot with 2 variables
- Avoid reordering and grouping duplicate x-values ggplot (geom_point)
- How to order points in a ggplot based on a variable I specify