
MYaseen208
Reputation: 23898
Showing data values on levelplot in R
I wonder if it is possible to show data values on levelplot (lattice package) in R. I'd appreciate if someone help me to do that. Thanks in advance.
Upvotes: 2
Views: 5372
Answers (1)

rcs
Reputation: 68839
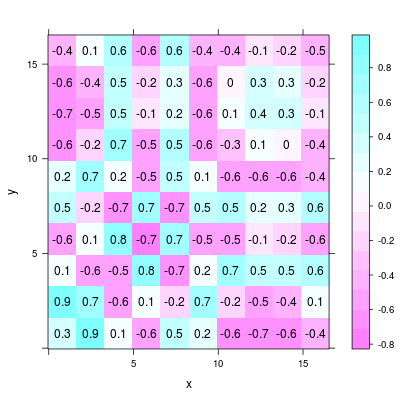
You can write your own panel function, e.g.:
library("lattice")
x <- seq(pi/4, 5*pi, length.out=10)
y <- seq(pi/4, 5*pi, length.out=10)
r <- as.vector(sqrt(outer(x^2, y^2, "+")))
grid <- expand.grid(x=x, y=y)
grid$z <- cos(r^2)*exp(-r/(pi^3))

p <- levelplot(z~x*y, grid,
               panel=function(...) {
                       arg <- list(...)
                       panel.levelplot(...)
                       panel.text(arg$x, arg$y, round(arg$z,1))})
print(p)
Upvotes: 14
Related Questions
- How to add text on a levelplot at specific coordinates?
- Adding Legends to Level Plots
- How to Add Labels to Top X-Axis of Levelplot in Lattice Package
- Color of levelplot in R
- R: display values in levelplot stratified by a grouping variable
- Add labels to levelplot
- Entering cell values from a matrix into a levelplot made in lattice in r
- Levelplot not plotted correctly, values not overlaid on grids
- How to show matrix values on Levelplot
- How can I use levelplot to show data only at observed indices?