
PatrickT
Reputation: 10530
Julia: ImplictPlots in a loop: setting colors
How can I assign colors with implicit_plot?
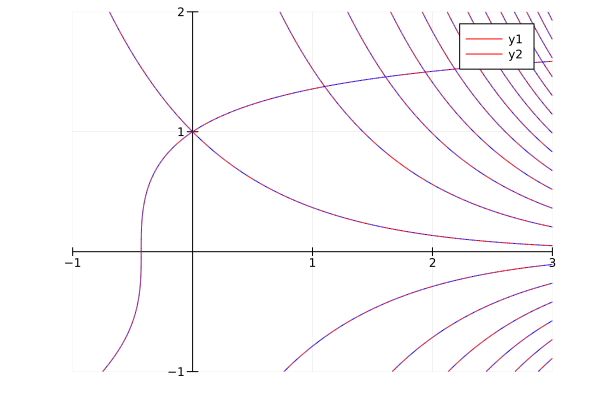
using ImplicitPlots, Plots
v = [(x,y) -> (x+3)*(y^3-7)+18, (x,y) -> sin(y*exp(x)-1)]
p = plot()
for f in v
    implicit_plot!(f; xlims = (-1, 3), ylims = (-1, 2), framestyle = :origin, lc = [:red, :blue])
end
p
I expected something along the lines of:
lc = [:red, :blue]
for (i, f) in enumerate (v)
    implicit_plot!(f; xlims = (-1, 3), ylims = (-1, 2), lc = lc[i])
end
How can I pass a gradient of blue colors for the second function? (I can pass lc = :blues but that makes the first line blue as well.)
Bonus question: Can I pass a vector or tuple to implicit_plot? I guess it's not supported.
Upvotes: 3
Views: 378
Answers (1)

Benoit Pasquier
Reputation: 3015
Are you sure it does not work? I tried
lc = [:red, :blue]
for (i, f) in enumerate(v)
    implicit_plot!(f; xlims = (-1, 3), ylims = (-1, 2), lc = lc[i])
end
and I got

(You had an extra space in enumerate which maybe threw you off?)
Not sure about the tuple of functions.
Upvotes: 2
Related Questions
- How do I add plots to separate figures using for loops in Julia
- Creating a subplot after adding plots using for loop
- Apply colormap when plotting array in Julia
- Adding multiple layers in Julia Gadfly plot with loops
- Multi plots in Julia
- Is there a way to plot graph in julia while executing loops?
- Julia Plots.jl: changing marker colour from series recipe
- How to plot multiple curves on same plot in julia?
- Plotting with Julia multiple graphs in a loop or function
- julia-lang - using Colors.jl arrays with PyPlot commands