Reputation: 541
Making a pivot table across multiple columns of non-numeric data
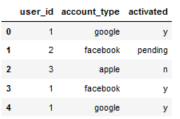
The following code generates a dummy dataframe:
import pandas as pd

df = pd.DataFrame(
    {
        'user_id': [1,2,3,1,1],
        'account_type': ['google','facebook','apple','facebook','google'],
        'activated': ['y','pending','n','y','y']

    }
)

df.head()

What I need is to create a pivot table for unique_values in the account_type column, which aggregates by the user_id column.
Essentially, for each user_id, I want to see how many of each types of accounts have a value other than n under the activated column.
The resulting dataframe should be:
I'm beat by this so far because I the pivot_table function seems to only be able to work with numeric values.
Upvotes: 0
Views: 202
Answers (2)

Reputation: 862611
Use DataFrame.assign for new column filled by mask compared activated for no n, and then pivoting by DataFrame.pivot_table with aggfunc=sum for count Trues:
df = (df.assign(new= df['activated'].ne('n'))
        .pivot_table(index='user_id',
                     columns='account_type',
                     values='new',
                     fill_value=0,
                     aggfunc='sum')
         .rename_axis(columns=None))

print (df)
         apple  facebook  google
user_id
1            0         1       2
2            0         1       0
3            0         0       0
Upvotes: 1

Reputation: 24314
Try Via groupby(), where() and transform() method:
df['count']=(df.groupby(['user_id','account_type'])['activated']
           .transform(lambda x:x.where(df['activated'].ne('n')).count()))
Finally use pivot_table() and rename_axis() method:
result=df.pivot_table(index='user_id',columns='account_type',values='count',fill_value=0).rename_axis(columns=None)
Output of result:
          apple     facebook    google
user_id
1           0       1           2
2           0       1           0
3           0       0           0
Upvotes: 2
Related Questions
- Pivoting a Pandas Dataframe containing strings - 'No numeric types to aggregate' error
- Pivot table for non numerical data frame pandas
- How to groupby and pivot a dataframe with non-numeric values
- pivot_table() to a df no numeric types to aggregate
- Pandas - Pivot table based on non-numerical data
- Pivoting a Pandas Dataframe, no numeric types, index is not unique
- Pandas: pivot dataframe and preserve additional non-numeric column
- Combining categorical data with numeric data when using pivot_table
- pandas - pivot_table with non-numeric values? (DataError: No numeric types to aggregate)
- Pivot Pandas Dataframe with a Mix of Numeric and Text Fields
