
Magesh Maggi
Reputation: 325
How to make relation with two sheets in excel or Power BI dashboard
Query : How to make relation between the table. In Power BI, I need to create a dashboard with two bar charts, the first of which will display reports by category. Second, the chart will display the product-based report. However, in order to create an interactive main chart, I need to connect two sheets. If you click the corresponding category in the main chart, the second chart will be based on the first chart's selected category. How to do that?
Main Report:
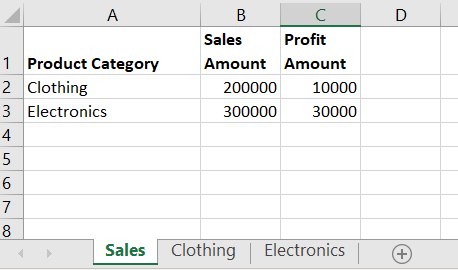
ProductWise Report:


Upvotes: 0
Views: 285
Answers (1)

Mr Robot
Reputation: 322
Try to import data in separate sheet.
then just put categories to bar chart and remaining columns to other graph, Its automatically change.
Upvotes: 0
Related Questions
- How can I create a relationship matrix in Excel
- How to create 2 active relationship between 2 tables
- How to use 3 different table relationship in Power BI?
- Combine two tables in Power BI
- Power BI - How to manage relationship between 2 tables for 1 to many rows
- Power Bi Desktop - How to add values between tables?
- PowerBI - Match Value from another table
- Join two tables on Power BI using same key in Table A
- How join other sheet to main sheet like DB relation?
- create relationship based on two columns