
Girolamo
Reputation: 311
Generating dataframe from Counter object
I'm trying to visualize the correlation between POS values.
From the list below I want to generate a dataframe where columns are equal to keys and the first row is equal to values.
I need this, to, after, plot df.corr()
Here are the variables:
keys = Counter(list_tag).keys()
keys
dict_keys(['NNP', 'VBZ', 'DT', 'NN', '.', 'PRP', 'VBD', 'IN', 'JJ', 'NNS', ',', '``', 'NNPS', "''", 'PRP$', 'CD', 'VB', 'TO', 'POS', 'RB', 'RBR', 'WP', 'MD', 'VBP', 'CC', 'WRB', 'WDT', 'RP', ':', 'VBN', 'VBG', 'EX', '(', 'JJR', ')', 'PDT', 'FW', 'RBS', 'JJS', 'UH'])
values = Counter(list_tag).values()
values
dict_values dict_values([282, 110, 259, 426, 106, 132, 60, 275, 204, 98, 119, 12, 3, 11, 41, 24, 80, 46, 25, 177, 7, 14, 30, 64, 112, 13, 10, 10, 21, 45, 42, 11, 12, 8, 12, 1, 1, 1, 2, 4])
My trouble is this:
calling df = pd.DataFrame(Counter(list_tag), index=Counter(list_tag).keys())
As shown below, I'm writing something wrong because I need only the first row.
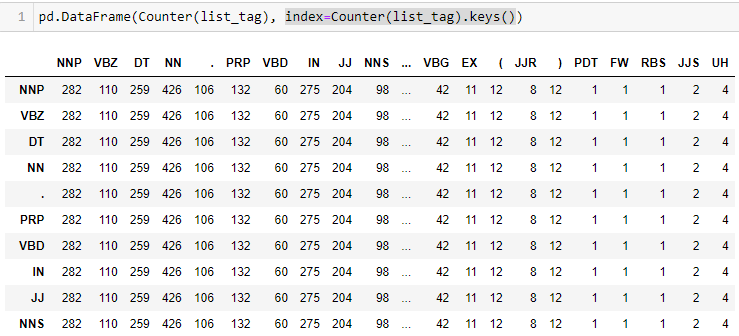
Is there an efficient solution to accomplish this without manual dropping of df.iloc[2:]
Thank you!
Upvotes: 0
Views: 279
Answers (1)

Mortz
Reputation: 4939
keys = ['NNP', 'VBZ', 'DT', 'NN', '.', 'PRP', 'VBD', 'IN', 'JJ', 'NNS', ',', '``', 'NNPS', "''", 'PRP$', 'CD', 'VB', 'TO', 'POS', 'RB', 'RBR', 'WP', 'MD', 'VBP', 'CC', 'WRB', 'WDT', 'RP', ':', 'VBN', 'VBG', 'EX', '(', 'JJR', ')', 'PDT', 'FW', 'RBS', 'JJS', 'UH']
values = [282, 110, 259, 426, 106, 132, 60, 275, 204, 98, 119, 12, 3, 11, 41, 24, 80, 46, 25, 177, 7, 14, 30, 64, 112, 13, 10, 10, 21, 45, 42, 11, 12, 8, 12, 1, 1, 1, 2, 4]

df = pd.DataFrame(values, index=keys).transpose()
Upvotes: 1
Related Questions
- Scripting a simple counter
- Python Convert Counters into DataFrame Columns
- Build a pandas Dataframe from multiple "Counter" Collection objects
- Map Counter Object to DataFrame to create new column
- Transform a Counter object into a Pandas DataFrame
- Using Counter() function in python
- Add counter as an additional column in Python pandas dataframe
- python dataframe counter on a column
- Python: How to add counter object to dataframe?
- Inserting counter objects into Dataframe python