
Reputation: 72739
Dynamic position for ggplot2 objects (especially geom_text)?
When using ArcGIS to make maps, the software by default pushes point and polygon labels around automatically to avoid overlap using a proprietary algorithm. They refer to this as dynamic labeling. ggplot2 has position_jitter which is excellent for points (since dynamic labeling might create systematic bias), but less good for labels using geom_text.
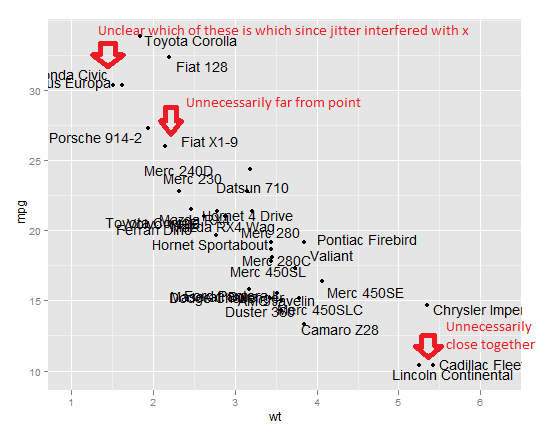
Here's an example of some problems with jitter that a dynamic labeling algorithm might solve:
library(ggplot2)
ggplot( mtcars,aes( x=wt, y=mpg, label=rownames(mtcars) ) ) +
  geom_point() +
  geom_text( position=position_jitter(h=1,w=1) )
Does such a dynamic labeling feature exist already in ggplot2?
If not, what algorithms exist for doing so and is it possible to implement a position_dynamic in R?
Upvotes: 18
Views: 12285
Answers (4)

Reputation: 846
Check out the new package ggrepel. ggrepel provides geoms for ggplot2 to repel overlapping text labels. It works both for geom_text and geom_label.
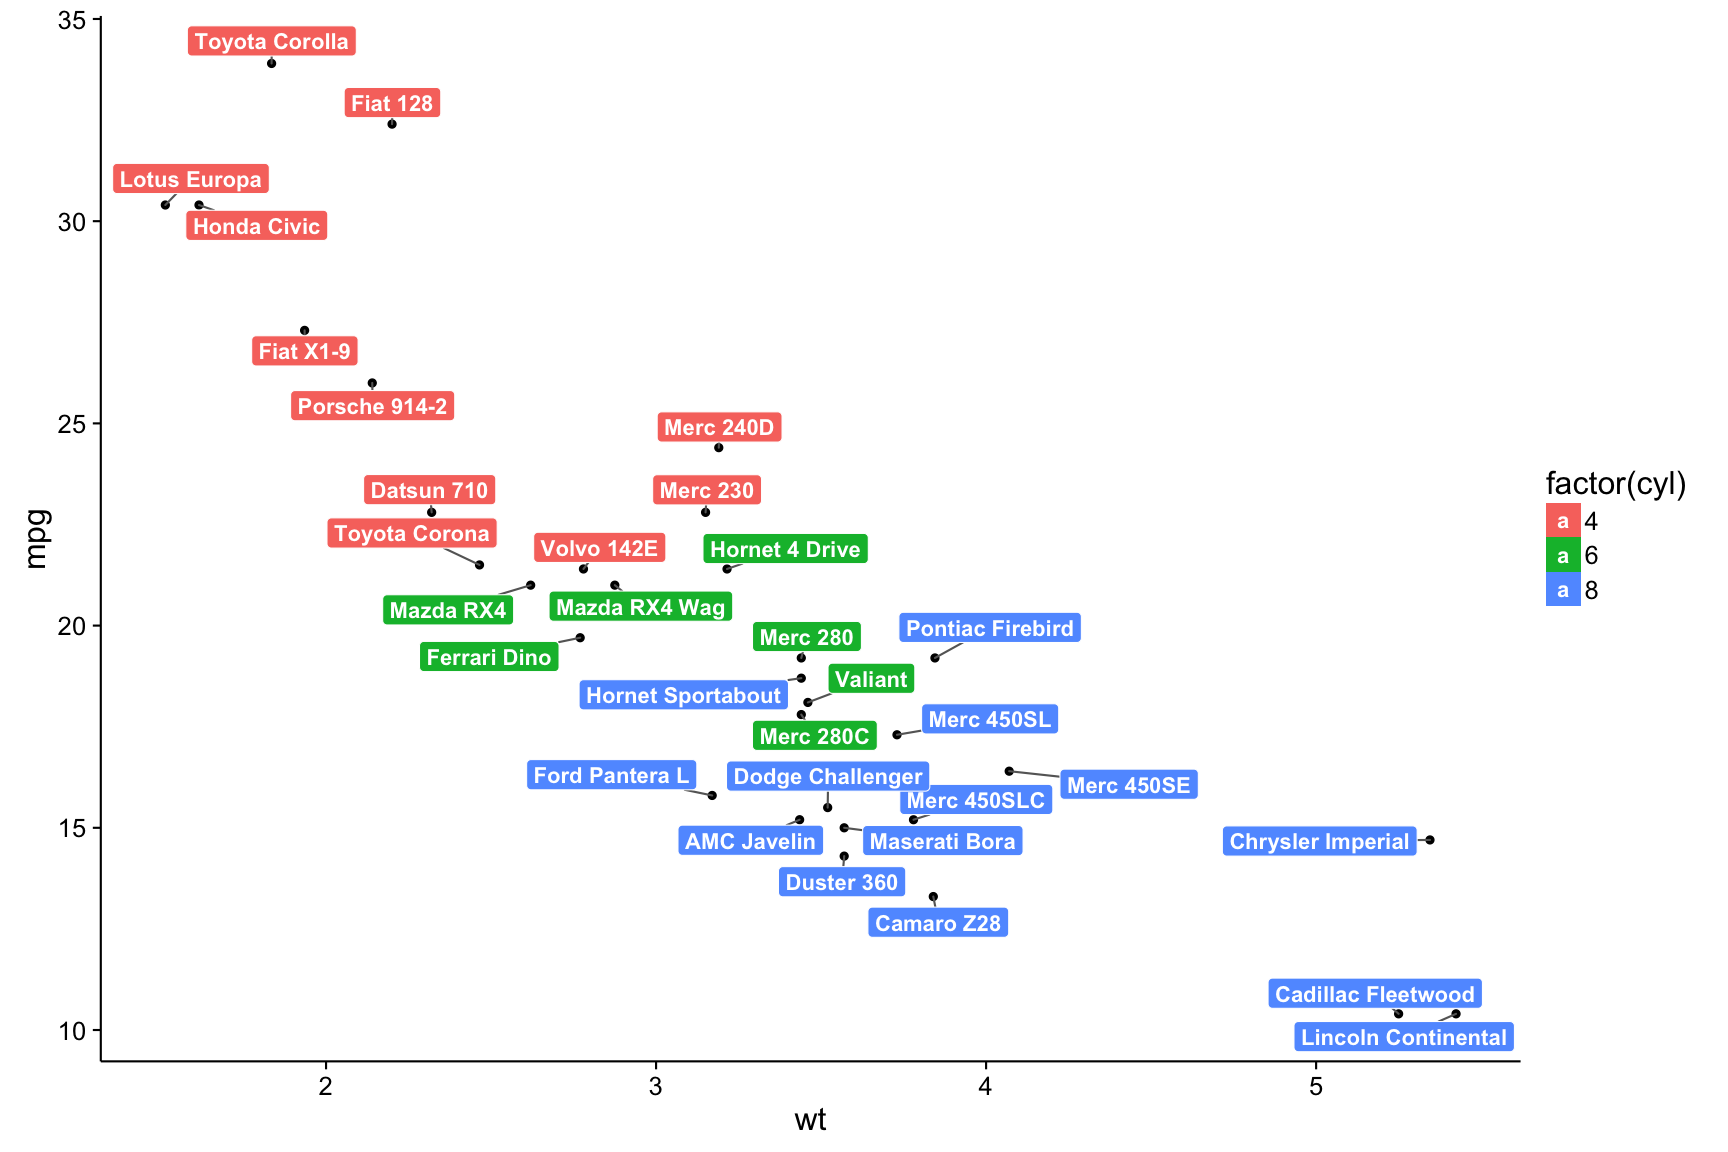
Figure is taken from this blog post.
Upvotes: 12

Reputation: 91
I ran into a similar problem with several of the plots I have been working with and wrote a basic package that uses force field simulation to adjust object location. While much improvement is possible, including integration with ggplot, etc. it seems to get the task accomplished. The following illustrates the functionality:
install.packages("FField", type = "source")
install.packages("ggplot2")
install.packages("gridExtra")
library(FField)
FFieldPtRepDemo()
Upvotes: 9

Reputation: 179458
AFAIK, the best that exists is directlabels, available from R-forge and CRAN and with a comprehensive examples page.
This seems a good starting point, but in my opinion has the following negative aspects:
- Unlike the
ggplotphilosophy of separating data and presentation,directlabelsreturns a ggplot object rather than a geom - it only works on the
groupaesthetic, not individual points
I have glanced at the source code some time ago and I think it should be reasonably easy to adapt the code to address both points I mention.
There is an example of how to use this with ggplot in this question on SO
Upvotes: 8

Reputation: 174843
This isn't anything that can be used directly in ggplot2, but the ordipointlabel() function in package vegan tries to do something similar. It displays data as points and tries to label each point with the appropriate label, using an optimisation algorithm to position the labels next to their point but without overlapping other labels and points.
?ordipointlabel mentions that it is based on pointlabel() in the maptools package, which could be another place to look for inspiration.
Upvotes: 7
Related Questions
- Specify position of geom_text by keywords like "top", "bottom", "left", "right", "center"
- Geom_text position with ggplotly
- Sorting out the geom_text() placement in ggplot
- Position argument of geom_text to set different tags
- Text repel with a position argument in ggplot/R
- R - ggplot2 : the position for the geom_text doesn't work
- Automatically vary the positions of labels with geom_text when they overlie each other
- ggplot: geom_text with group argument for positioning
- geom_text positions per group
- Alternate geom_text position with hjust