samantha
Reputation: 25
R rank points in plot
I have a question about plots. For example we have variable a and b, we plot this in R and you get the point. Now, I want to make a range of best/highest point. Is there a way to generate a ranking in the point? I thought maybe something with mean?
Thanks!
a<- c(1,3,7,5,3,8,4,5,3,6,9,4,2,6,3)
b<- c(5,3,7,2,7,2,5,2,7,3,6,2,1,1,9)
plot(a,b)
Upvotes: 2
Views: 3910
Answers (1)

James
Reputation: 66844
Based on your comment to get the positions of the points with the 5 highest b values, use order:
order(b,decreasing=T)[1:5]
[1] 15  3  5  9 11
And you can use this to get the relevant a and b values:
a[order(b,decreasing=T)[1:5]]
[1] 3 7 3 3 9
b[order(b,decreasing=T)[1:5]]
[1] 9 7 7 7 6
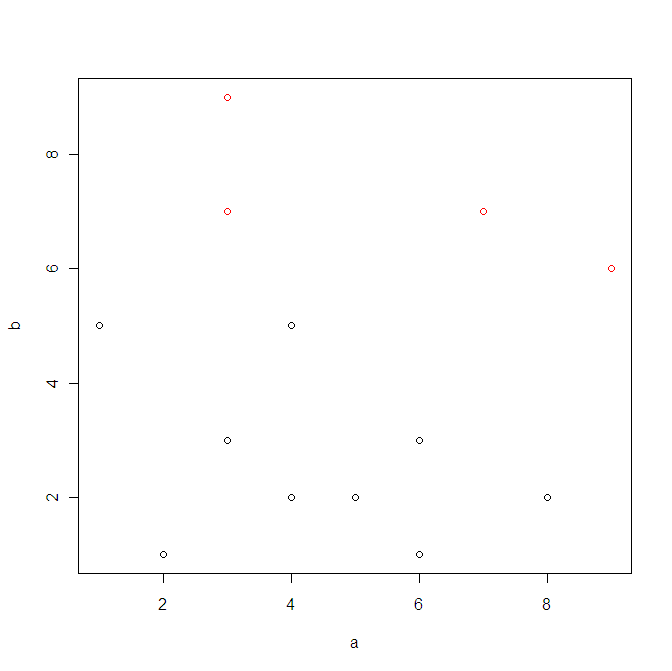
You can use this also to highlight them in the plot:
high <- order(b,decreasing=T)[1:5]
col <- rep("black",length(b))
col[high] <- "red"
plot(a,b,col=col)

Note that there is some overplotting here (2 values at (3,7))
Upvotes: 3
Related Questions
- How to create a specific chart in R?
- Plotting ranked data
- rank function in R only returning rank of 1
- Rank function in dplyr
- How the rank function works in R
- Rank per row over multiple columns in R
- Ranking rows in R
- R - extracting value by rank
- R rank rows according values
- Plotting rank for various models under different criteria in R