
Reputation: 14660
Plotting points in 3d from text file using Matplotlib or Octave
Hi I have a text file containing three columns of numbers; one column each for the x,y,z coordinates of a bunch of points. All numbers are between 0 ad 1.
I want to plot all these points in the unit cube [0,1]x[0,1]x[0,1].
Please let me know how I can do this in Octave or MatPlot lib, whichever prduces a better quality image.
Upvotes: 0
Views: 2850
Answers (1)

Reputation: 35543
If I understand your question correctly, this is how it looks in Matplotlib:
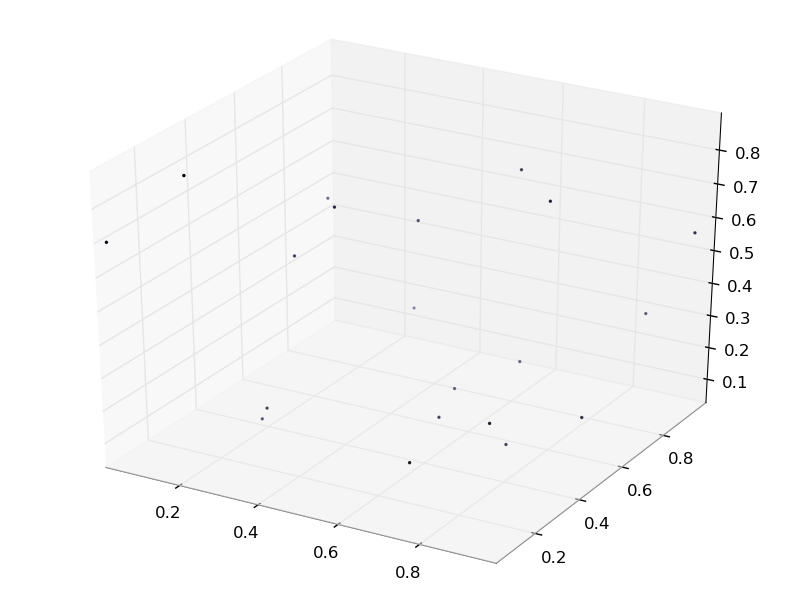
This is the code to produce this plot:
import matplotlib.pyplot as plt
from mpl_toolkits.mplot3d import Axes3D
import numpy as np

np.random.seed(101)
x,y,z = np.random.rand(3,20)

fig = plt.figure()
# version 1.0.x syntax:
#ax = fig.add_subplot(111, projection='3d')
# version 0.99.x syntax: (accepted by 1.0.x as well)
ax = Axes3D(fig)

ax.scatter(x,y,z)

fig.savefig('scatter3d.png')
As the code suggests, there are slight differences in how matplotlib version 0.99.1.1 and version 1.0.1 behave, as noted in this SO question/answer. I am using 0.99.1.1, and I had trouble using all the options available to 2D scatter plots, which should be the same for 3D plots as well. The full list of scatter features are listed here.
The above code resulted from looking at the matplotlib tutorial on 3D plotting.
Upvotes: 3
Related Questions
- Plot data as 3d function from text
- Ploting 3D points from csv file, Python?
- issue in 3D plotting in python using data from a text file
- Plotting data contained in .mat file with python
- Python-xy 3d plot from text file
- Drawing 3D points on a 2D plot reading values from a file
- Matplotlib 3D hypocenter plot, reading xyz values from .txt file
- Reading a text file and plotting it in 3D
- Plotting 3d data in matplotlib
- 3D Graph in Octave/Matlab from a CSV file