Reputation: 53
JFreeChart alternate background color
I'm trying to set two colors that need to be switched at every vertical tick label as background of a JFreeChart linechart.
I want the line chart to appear as the image in this link, where two different light grays alternate as background:

How can I achieve so in JFreeChart?
P.S. I've seen that there is plot.setRangeTickBandPaint(new Color(200, 200, 100, 100)) method for XYPlot plot type, used in ScatterPlot4 in JFreeChart's demo jar, however, this method does not exist in the line chart plot type.
Upvotes: 1
Views: 401
Answers (1)
Reputation: 205775
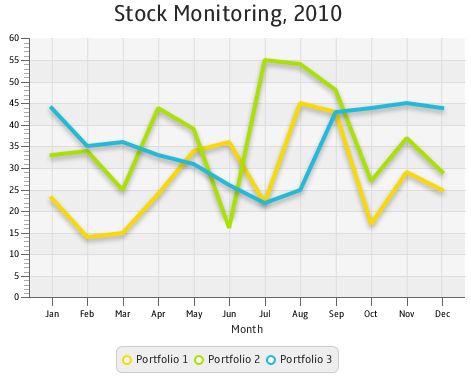
Starting from this time series example and using setRangeTickBandPaint(), I get the result pictured below:
In particular, I used
Contrasting colors for the background and bands:
  plot.setBackgroundPaint(new Color(0xF0F0F0));
  plot.setRangeTickBandPaint(new Color(0xE0E0E0));
A suitable
DateFormaton the domain:domain.setDateFormatOverride(new SimpleDateFormat("MMM"));A fixed
TickUniton the range:NumberAxis range = (NumberAxis) plot.getRangeAxis(); range.setTickUnit(new NumberTickUnit(5));DateTickMarkPosition.MIDDLEto center the tick labels:domain.setTickMarkPosition(DateTickMarkPosition.MIDDLE);
As an aside, there is no line chart plot type. Instead, contrast the source of your chosen ChartFactory with that of a typical time series.
Upvotes: 2
Related Questions
- Can't change colour of lines on graph: JFreeChart
- Changing background colour of jFreeChart
- JFreeChart background color setting is not respected
- JFreeChart Bar chart custom color?
- Difficulty Changing background colour of JFreeChart
- Change part of background color of a JFreeChart dynamically?
- Using jfreechart, how would I change the color and style of the series
- JFreeChart grid line Color
- Change the Lines Style and colour of a JFreeChart
- Change Background Dashed Lines JFreeChart
