
user257122
Reputation: 51
How to plot barchart with error bar and dots using lattice?
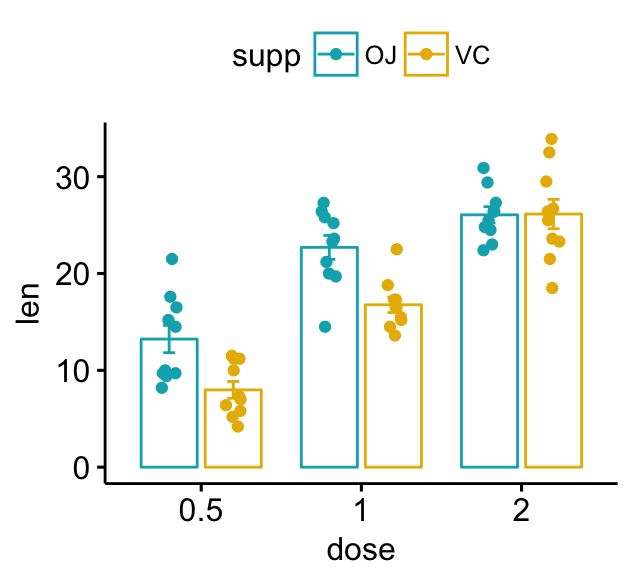
I am trying to plot bar chart with errorbar and dots representing single data value using lattice, what I expected is the figure like this from this page. However, lattice outputs wrongs after I tried to use panel.barchart combind with panel.xyplot:
barchart(len ~ dose + supp,
  data = ToothGrowth,
  panel = function(x, y, ...) {
    panel.barchart(x, y, ...)
    panel.xyplot(..., jitter.x = TRUE)
    panel.segments(x0 = x, y0 = y-0.5, x1 = x, y1 = y+0.5)
}
I would like to know can lattice do this job, and if can, how to do this?
Thanks for any help!
Upvotes: 1
Views: 119
Answers (1)

Deepayan Sarkar
Reputation: 196
Calling this a barchart is misleading, it's more like a strip plot with a confidence interval. Here's one possible implementation:
panel.ci <- function(x, y, col.symbol, ...)
{
    col <- col.symbol
    ## points
    panel.points(jitter(x, amount = 0.2), y,
                 col = col, pch = 16, cex = 1.5, alpha = 0.5)
    ## summaries
    m <- tapply(y, x, mean)
    s <- tapply(y, x, sd) / sqrt(tapply(y, x, length))
    ## 'bars'
    ux <- sort(unique(x))
    w <- 0.45 # rectangle half-width
    panel.rect(ux - w, 0, ux + w, m, border = col, lwd = 2)
    ## confidence interval
    panel.arrows(ux, m - 1.96 * s, ux, m + 1.96 * s, col = col,
                 length = 0.1, angle = 90, code = 3, lwd = 2)
}
xyplot(len ~ supp | factor(dose), data = ToothGrowth, groups = supp,
       layout = c(3, 1), ylim = c(-1, NA), pch = 16, col = 2:3,
       panel = panel.superpose, panel.groups = panel.ci)
Upvotes: 2
Related Questions
- Optional argument in pytest.mark.parametrize
- Make multiple @pytest.mark.parametrize with pytest
- Passing arguments to pytest.mark.parametrize via command line arguments
- How to set dynamic marks parameter in pytest.param when using pytest_generate_tests()
- Renaming parameters in pytest.mark.parametrize
- How can I loop over the @pytest.mark.parametrize data or print it on the tests
- Mark inputs in pytest parametrize
- How to mark.parametrize() a Pytest fixture
- pytest mark parametrize: different assertion during each iteration
- Create decorator compatible with pytest.mark.parametrize