
Reputation: 1843
How to create a Venn diagram in R with the universal set represented in the background?
I'm trying to create a Venn diagram in R where the complement set is also indicated along with the sets of interest. By "complement set" I am referring to the set of elements not included in the sets of interest; I hope this is the correct term for it (please do indicate the correct terminology if I am wrong).
With this toy data set, I am able to have the complement show up as portion of an ellipse representing the universal set (the set of all of these sets) as shown below:
library(ggVennDiagram)

set.seed(44)

uset <- replicate(1000, paste0(sample(letters, size = 40, replace = TRUE), collapse = ""))
set1 <- sample(uset, size = 200)
set2 <- sample(uset, size = 600)
set3 <- sample(uset, size = 800)

ggVennDiagram(list(uset, set1, set2, set3), category.names = c("Universe", "Set1", "Set2", "Set3"))

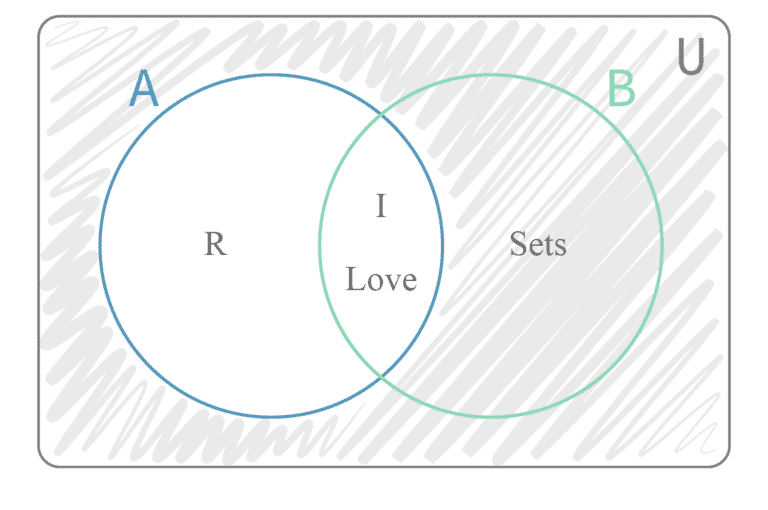
However, this is not quite what I am looking for. I would actually like to have the complement set show up as the value assigned to the (hypothetical rectangular) background space that the Venn diagram is presented in. Something a bit like the shaded region in this Venn diagram here (https://quantifyinghealth.com/wp-content/uploads/2022/07/venn-diagram-representing-the-complement-of-a-A-768x510.png ; StackOverflow does not allow me to embed this image).
I cannot seem to figure out how to do this in R. Any pointers would be much appreciated.
Upvotes: 0
Views: 345
Answers (1)

Reputation: 144
I modified your ggVennDiagram by removing uset. Since ggVennDiagram is based on ggplot2, load the library, and add an annotated rectangle. Notice the size of the rectangle is (0, no of data points) in the x and y directions.
library(ggVennDiagram)
library(ggplot2)

set.seed(44)

uset <- replicate(1000, paste0(sample(letters, size = 40, replace = TRUE), collapse = ""))
set1 <- sample(uset, size = 200)
set2 <- sample(uset, size = 600)
set3 <- sample(uset, size = 800)

ggVennDiagram(list(set1, set2, set3), category.names = c("Set1", "Set2", "Set3")) +
  geom_rect(aes(xmin = 0, xmax = 1000, ymin = 0, ymax = 1000), color='black', fill='blue', alpha=.1) +
  geom_text(aes(x = 1000, y = 1000, label = paste0("Universal (", 1000, ")")), vjust = 1, hjust = 1)
Upvotes: 1
Related Questions
- Application Insights - How to sort by custom dimension
- Azure Data Explorer get Distinct values and order by
- Kusto Sort by aggregate like Count
- Priority Sorting on a column Kusto Query
- Order by number of matching words
- Queries with calculated fields and sorting
- Azure / U-SQL - ORDER BY in ROW_NUMBER()
- How to sort a numeric dimension in ssas
- SQL Server Order by numeric varchar
- Possible to order by RowKey in Azure Table Storage